Immigrants from Dominican Republic vs Immigrants from Malaysia High School Diploma
COMPARE
Immigrants from Dominican Republic
Immigrants from Malaysia
High School Diploma
High School Diploma Comparison
Immigrants from Dominican Republic
Immigrants from Malaysia
82.0%
HIGH SCHOOL DIPLOMA
0.0/ 100
METRIC RATING
336th/ 347
METRIC RANK
89.3%
HIGH SCHOOL DIPLOMA
63.5/ 100
METRIC RATING
157th/ 347
METRIC RANK
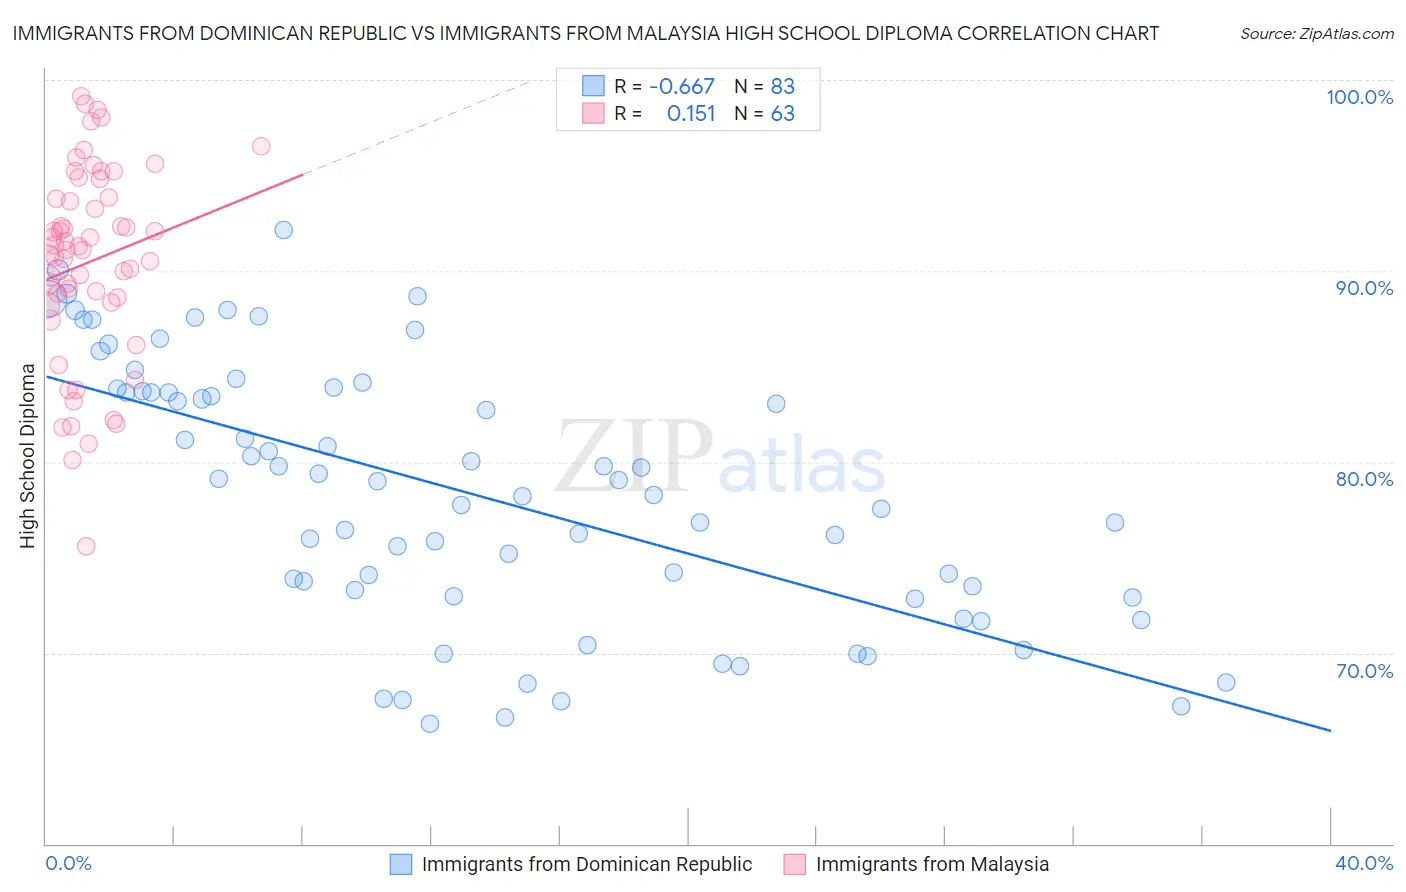
Immigrants from Dominican Republic vs Immigrants from Malaysia High School Diploma Correlation Chart
The statistical analysis conducted on geographies consisting of 275,144,349 people shows a significant negative correlation between the proportion of Immigrants from Dominican Republic and percentage of population with at least high school diploma education in the United States with a correlation coefficient (R) of -0.667 and weighted average of 82.0%. Similarly, the statistical analysis conducted on geographies consisting of 197,973,709 people shows a poor positive correlation between the proportion of Immigrants from Malaysia and percentage of population with at least high school diploma education in the United States with a correlation coefficient (R) of 0.151 and weighted average of 89.3%, a difference of 9.0%.
High School Diploma Correlation Summary
| Measurement | Immigrants from Dominican Republic | Immigrants from Malaysia |
| Minimum | 66.3% | 75.6% |
| Maximum | 92.2% | 99.1% |
| Range | 25.9% | 23.6% |
| Mean | 78.4% | 90.4% |
| Median | 79.0% | 91.1% |
| Interquartile 25% (IQ1) | 73.0% | 88.3% |
| Interquartile 75% (IQ3) | 83.7% | 93.9% |
| Interquartile Range (IQR) | 10.8% | 5.5% |
| Standard Deviation (Sample) | 6.8% | 5.1% |
| Standard Deviation (Population) | 6.7% | 5.1% |
Similar Demographics by High School Diploma
Demographics Similar to Immigrants from Dominican Republic by High School Diploma
In terms of high school diploma, the demographic groups most similar to Immigrants from Dominican Republic are Guatemalan (82.0%, a difference of 0.010%), Tohono O'odham (82.1%, a difference of 0.12%), Immigrants from Yemen (81.8%, a difference of 0.15%), Immigrants from Latin America (82.1%, a difference of 0.23%), and Salvadoran (81.7%, a difference of 0.32%).
| Demographics | Rating | Rank | High School Diploma |
| Hispanics or Latinos | 0.0 /100 | #329 | Tragic 82.9% |
| Immigrants | Azores | 0.0 /100 | #330 | Tragic 82.8% |
| Central Americans | 0.0 /100 | #331 | Tragic 82.5% |
| Immigrants | Honduras | 0.0 /100 | #332 | Tragic 82.5% |
| Immigrants | Latin America | 0.0 /100 | #333 | Tragic 82.1% |
| Tohono O'odham | 0.0 /100 | #334 | Tragic 82.1% |
| Guatemalans | 0.0 /100 | #335 | Tragic 82.0% |
| Immigrants | Dominican Republic | 0.0 /100 | #336 | Tragic 82.0% |
| Immigrants | Yemen | 0.0 /100 | #337 | Tragic 81.8% |
| Salvadorans | 0.0 /100 | #338 | Tragic 81.7% |
| Pima | 0.0 /100 | #339 | Tragic 81.6% |
| Houma | 0.0 /100 | #340 | Tragic 81.5% |
| Mexicans | 0.0 /100 | #341 | Tragic 81.4% |
| Immigrants | Guatemala | 0.0 /100 | #342 | Tragic 81.4% |
| Immigrants | El Salvador | 0.0 /100 | #343 | Tragic 80.8% |
Demographics Similar to Immigrants from Malaysia by High School Diploma
In terms of high school diploma, the demographic groups most similar to Immigrants from Malaysia are Immigrants from Pakistan (89.3%, a difference of 0.020%), Immigrants from China (89.3%, a difference of 0.020%), Immigrants from Argentina (89.4%, a difference of 0.030%), Laotian (89.3%, a difference of 0.030%), and Brazilian (89.3%, a difference of 0.040%).
| Demographics | Rating | Rank | High School Diploma |
| Argentineans | 72.3 /100 | #150 | Good 89.5% |
| Paraguayans | 71.4 /100 | #151 | Good 89.5% |
| Asians | 70.7 /100 | #152 | Good 89.4% |
| Immigrants | Iraq | 68.7 /100 | #153 | Good 89.4% |
| Alsatians | 66.8 /100 | #154 | Good 89.4% |
| Immigrants | Northern Africa | 66.4 /100 | #155 | Good 89.4% |
| Immigrants | Argentina | 65.5 /100 | #156 | Good 89.4% |
| Immigrants | Malaysia | 63.5 /100 | #157 | Good 89.3% |
| Immigrants | Pakistan | 62.5 /100 | #158 | Good 89.3% |
| Immigrants | China | 62.0 /100 | #159 | Good 89.3% |
| Laotians | 61.8 /100 | #160 | Good 89.3% |
| Brazilians | 61.2 /100 | #161 | Good 89.3% |
| Bermudans | 61.1 /100 | #162 | Good 89.3% |
| Cree | 61.1 /100 | #163 | Good 89.3% |
| Immigrants | Nepal | 61.1 /100 | #164 | Good 89.3% |