Tongan vs Immigrants from Malaysia High School Diploma
COMPARE
Tongan
Immigrants from Malaysia
High School Diploma
High School Diploma Comparison
Tongans
Immigrants from Malaysia
88.4%
HIGH SCHOOL DIPLOMA
9.5/ 100
METRIC RATING
220th/ 347
METRIC RANK
89.3%
HIGH SCHOOL DIPLOMA
63.5/ 100
METRIC RATING
157th/ 347
METRIC RANK
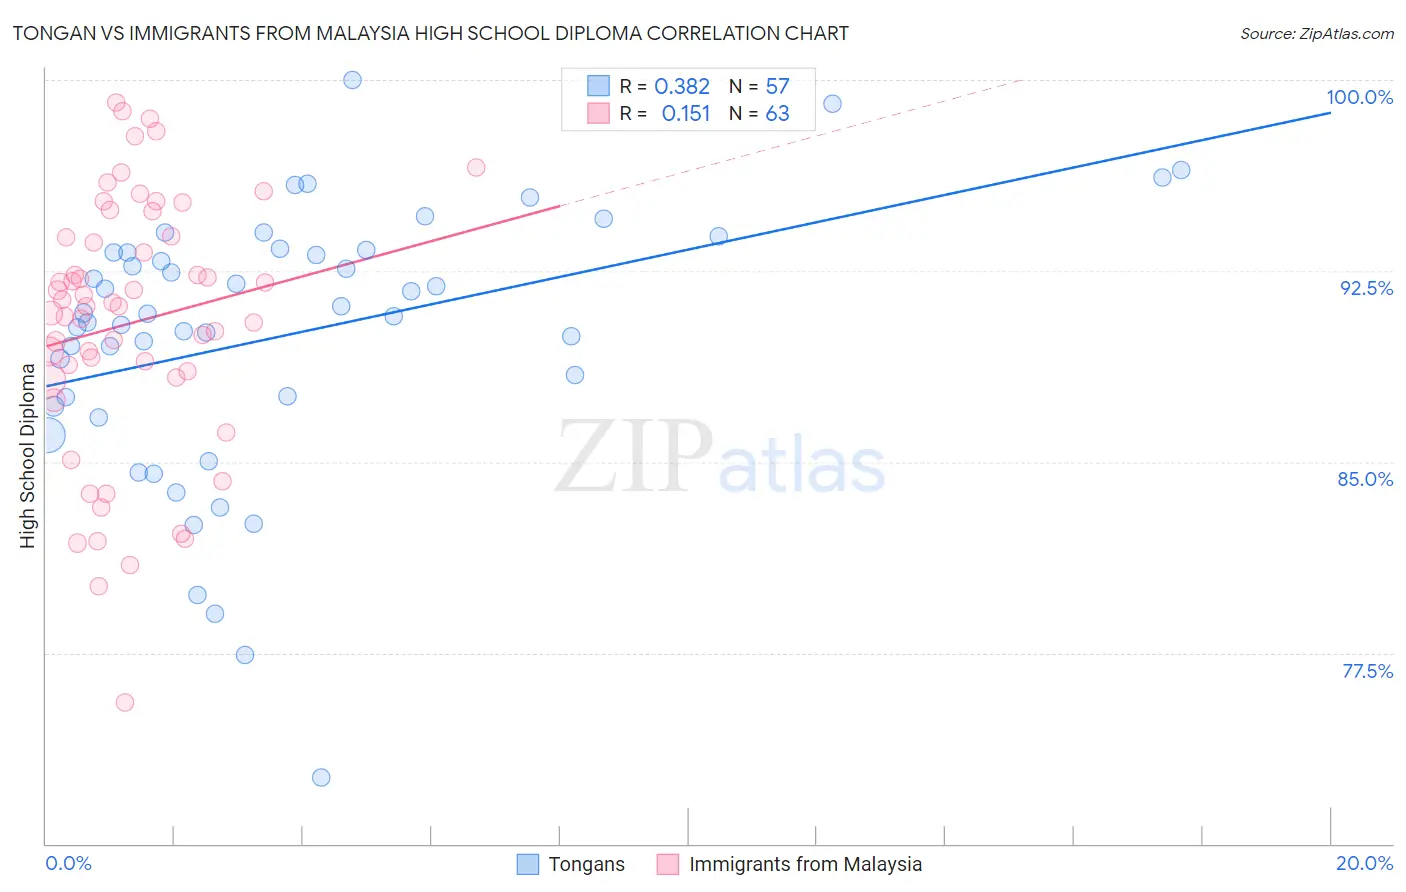
Tongan vs Immigrants from Malaysia High School Diploma Correlation Chart
The statistical analysis conducted on geographies consisting of 102,904,773 people shows a mild positive correlation between the proportion of Tongans and percentage of population with at least high school diploma education in the United States with a correlation coefficient (R) of 0.382 and weighted average of 88.4%. Similarly, the statistical analysis conducted on geographies consisting of 197,973,709 people shows a poor positive correlation between the proportion of Immigrants from Malaysia and percentage of population with at least high school diploma education in the United States with a correlation coefficient (R) of 0.151 and weighted average of 89.3%, a difference of 1.1%.
High School Diploma Correlation Summary
| Measurement | Tongan | Immigrants from Malaysia |
| Minimum | 72.6% | 75.6% |
| Maximum | 100.0% | 99.1% |
| Range | 27.4% | 23.6% |
| Mean | 90.0% | 90.4% |
| Median | 90.8% | 91.1% |
| Interquartile 25% (IQ1) | 87.4% | 88.3% |
| Interquartile 75% (IQ3) | 93.3% | 93.9% |
| Interquartile Range (IQR) | 5.9% | 5.5% |
| Standard Deviation (Sample) | 5.3% | 5.1% |
| Standard Deviation (Population) | 5.2% | 5.1% |
Similar Demographics by High School Diploma
Demographics Similar to Tongans by High School Diploma
In terms of high school diploma, the demographic groups most similar to Tongans are Costa Rican (88.4%, a difference of 0.0%), Immigrants from Bolivia (88.4%, a difference of 0.030%), Immigrants from Africa (88.4%, a difference of 0.040%), Immigrants from Afghanistan (88.3%, a difference of 0.040%), and Chickasaw (88.4%, a difference of 0.050%).
| Demographics | Rating | Rank | High School Diploma |
| Immigrants | Somalia | 11.3 /100 | #213 | Poor 88.4% |
| Immigrants | Cameroon | 10.9 /100 | #214 | Poor 88.4% |
| Crow | 10.9 /100 | #215 | Poor 88.4% |
| Chickasaw | 10.7 /100 | #216 | Poor 88.4% |
| Immigrants | Africa | 10.6 /100 | #217 | Poor 88.4% |
| Immigrants | Bolivia | 10.3 /100 | #218 | Poor 88.4% |
| Costa Ricans | 9.6 /100 | #219 | Tragic 88.4% |
| Tongans | 9.5 /100 | #220 | Tragic 88.4% |
| Immigrants | Afghanistan | 8.6 /100 | #221 | Tragic 88.3% |
| Colville | 7.8 /100 | #222 | Tragic 88.3% |
| Immigrants | Zaire | 7.6 /100 | #223 | Tragic 88.3% |
| Shoshone | 7.0 /100 | #224 | Tragic 88.3% |
| Creek | 6.9 /100 | #225 | Tragic 88.3% |
| Uruguayans | 5.6 /100 | #226 | Tragic 88.2% |
| Immigrants | Liberia | 5.5 /100 | #227 | Tragic 88.2% |
Demographics Similar to Immigrants from Malaysia by High School Diploma
In terms of high school diploma, the demographic groups most similar to Immigrants from Malaysia are Immigrants from Pakistan (89.3%, a difference of 0.020%), Immigrants from China (89.3%, a difference of 0.020%), Immigrants from Argentina (89.4%, a difference of 0.030%), Laotian (89.3%, a difference of 0.030%), and Brazilian (89.3%, a difference of 0.040%).
| Demographics | Rating | Rank | High School Diploma |
| Argentineans | 72.3 /100 | #150 | Good 89.5% |
| Paraguayans | 71.4 /100 | #151 | Good 89.5% |
| Asians | 70.7 /100 | #152 | Good 89.4% |
| Immigrants | Iraq | 68.7 /100 | #153 | Good 89.4% |
| Alsatians | 66.8 /100 | #154 | Good 89.4% |
| Immigrants | Northern Africa | 66.4 /100 | #155 | Good 89.4% |
| Immigrants | Argentina | 65.5 /100 | #156 | Good 89.4% |
| Immigrants | Malaysia | 63.5 /100 | #157 | Good 89.3% |
| Immigrants | Pakistan | 62.5 /100 | #158 | Good 89.3% |
| Immigrants | China | 62.0 /100 | #159 | Good 89.3% |
| Laotians | 61.8 /100 | #160 | Good 89.3% |
| Brazilians | 61.2 /100 | #161 | Good 89.3% |
| Bermudans | 61.1 /100 | #162 | Good 89.3% |
| Cree | 61.1 /100 | #163 | Good 89.3% |
| Immigrants | Nepal | 61.1 /100 | #164 | Good 89.3% |