Immigrants from South Central Asia vs Crow 10th Grade
COMPARE
Immigrants from South Central Asia
Crow
10th Grade
10th Grade Comparison
Immigrants from South Central Asia
Crow
94.5%
10TH GRADE
97.8/ 100
METRIC RATING
100th/ 347
METRIC RANK
94.7%
10TH GRADE
99.0/ 100
METRIC RATING
85th/ 347
METRIC RANK
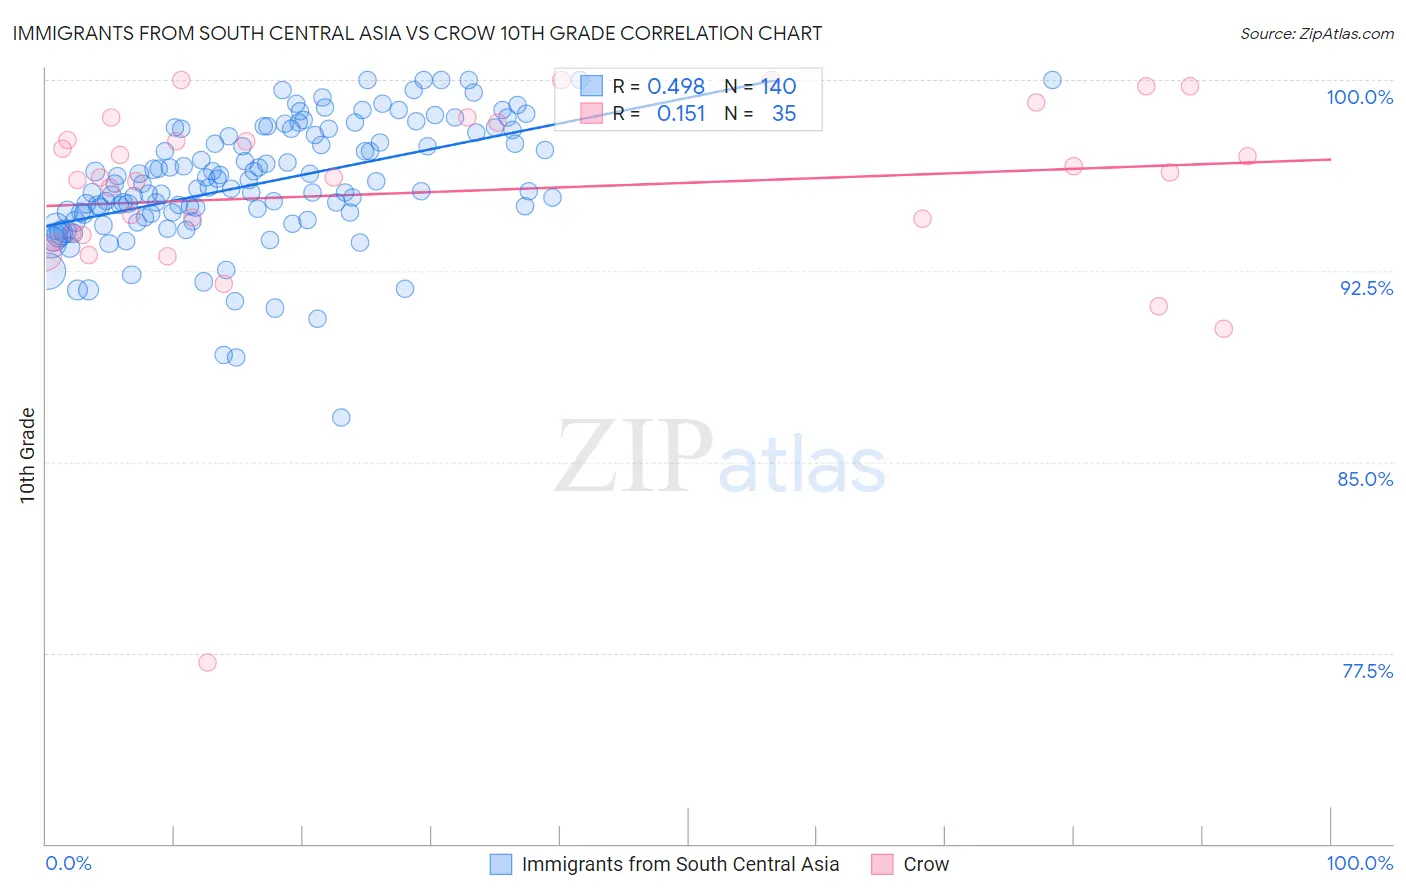
Immigrants from South Central Asia vs Crow 10th Grade Correlation Chart
The statistical analysis conducted on geographies consisting of 473,113,181 people shows a moderate positive correlation between the proportion of Immigrants from South Central Asia and percentage of population with at least 10th grade education in the United States with a correlation coefficient (R) of 0.498 and weighted average of 94.5%. Similarly, the statistical analysis conducted on geographies consisting of 59,209,940 people shows a poor positive correlation between the proportion of Crow and percentage of population with at least 10th grade education in the United States with a correlation coefficient (R) of 0.151 and weighted average of 94.7%, a difference of 0.19%.
10th Grade Correlation Summary
| Measurement | Immigrants from South Central Asia | Crow |
| Minimum | 86.8% | 77.1% |
| Maximum | 100.0% | 100.0% |
| Range | 13.2% | 22.9% |
| Mean | 96.0% | 95.6% |
| Median | 95.8% | 96.2% |
| Interquartile 25% (IQ1) | 94.7% | 93.9% |
| Interquartile 75% (IQ3) | 98.0% | 98.3% |
| Interquartile Range (IQR) | 3.3% | 4.4% |
| Standard Deviation (Sample) | 2.4% | 4.1% |
| Standard Deviation (Population) | 2.4% | 4.1% |
Demographics Similar to Immigrants from South Central Asia and Crow by 10th Grade
In terms of 10th grade, the demographic groups most similar to Immigrants from South Central Asia are Syrian (94.5%, a difference of 0.0%), Cambodian (94.5%, a difference of 0.010%), Immigrants from France (94.5%, a difference of 0.020%), Immigrants from Bulgaria (94.6%, a difference of 0.030%), and Immigrants from Germany (94.6%, a difference of 0.060%). Similarly, the demographic groups most similar to Crow are Puget Sound Salish (94.7%, a difference of 0.0%), Immigrants from Western Europe (94.7%, a difference of 0.010%), Icelander (94.7%, a difference of 0.010%), Immigrants from Saudi Arabia (94.7%, a difference of 0.010%), and Immigrants from Japan (94.7%, a difference of 0.010%).
| Demographics | Rating | Rank | 10th Grade |
| Swiss | 99.1 /100 | #82 | Exceptional 94.7% |
| Immigrants | Western Europe | 99.1 /100 | #83 | Exceptional 94.7% |
| Icelanders | 99.1 /100 | #84 | Exceptional 94.7% |
| Crow | 99.0 /100 | #85 | Exceptional 94.7% |
| Puget Sound Salish | 99.0 /100 | #86 | Exceptional 94.7% |
| Immigrants | Saudi Arabia | 99.0 /100 | #87 | Exceptional 94.7% |
| Immigrants | Japan | 99.0 /100 | #88 | Exceptional 94.7% |
| Immigrants | Moldova | 98.9 /100 | #89 | Exceptional 94.7% |
| South Africans | 98.8 /100 | #90 | Exceptional 94.7% |
| Whites/Caucasians | 98.8 /100 | #91 | Exceptional 94.7% |
| Yugoslavians | 98.4 /100 | #92 | Exceptional 94.6% |
| Soviet Union | 98.3 /100 | #93 | Exceptional 94.6% |
| Immigrants | Germany | 98.3 /100 | #94 | Exceptional 94.6% |
| Menominee | 98.3 /100 | #95 | Exceptional 94.6% |
| Immigrants | Switzerland | 98.3 /100 | #96 | Exceptional 94.6% |
| Lebanese | 98.3 /100 | #97 | Exceptional 94.6% |
| Immigrants | Bulgaria | 98.1 /100 | #98 | Exceptional 94.6% |
| Immigrants | France | 97.9 /100 | #99 | Exceptional 94.5% |
| Immigrants | South Central Asia | 97.8 /100 | #100 | Exceptional 94.5% |
| Syrians | 97.7 /100 | #101 | Exceptional 94.5% |
| Cambodians | 97.6 /100 | #102 | Exceptional 94.5% |