Immigrants from Dominica vs Bhutanese 3rd Grade
COMPARE
Immigrants from Dominica
Bhutanese
3rd Grade
3rd Grade Comparison
Immigrants from Dominica
Bhutanese
96.9%
3RD GRADE
0.0/ 100
METRIC RATING
298th/ 347
METRIC RANK
98.1%
3RD GRADE
97.2/ 100
METRIC RATING
106th/ 347
METRIC RANK
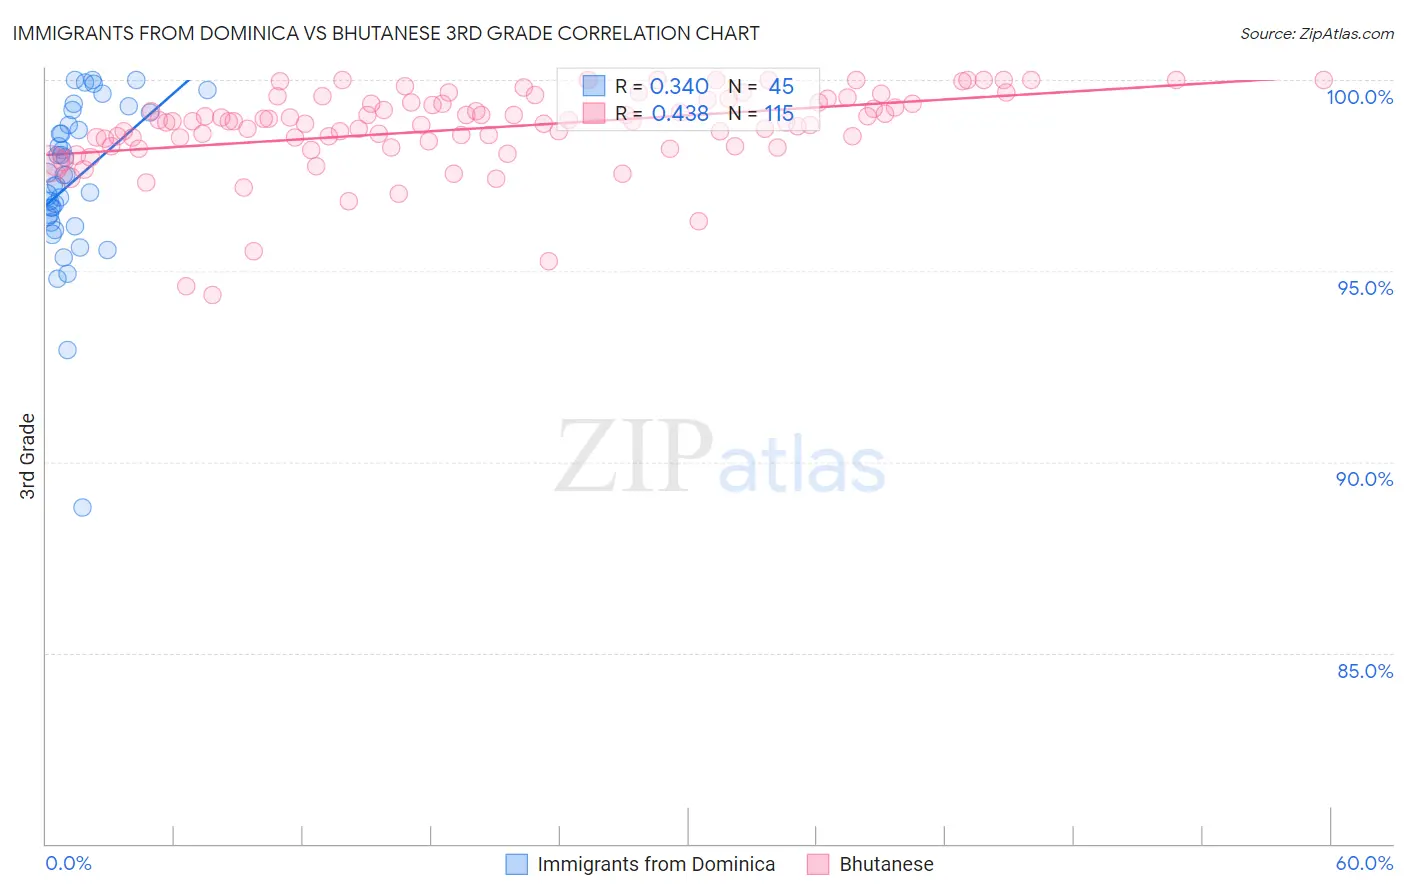
Immigrants from Dominica vs Bhutanese 3rd Grade Correlation Chart
The statistical analysis conducted on geographies consisting of 83,794,115 people shows a mild positive correlation between the proportion of Immigrants from Dominica and percentage of population with at least 3rd grade education in the United States with a correlation coefficient (R) of 0.340 and weighted average of 96.9%. Similarly, the statistical analysis conducted on geographies consisting of 455,590,842 people shows a moderate positive correlation between the proportion of Bhutanese and percentage of population with at least 3rd grade education in the United States with a correlation coefficient (R) of 0.438 and weighted average of 98.1%, a difference of 1.2%.
3rd Grade Correlation Summary
| Measurement | Immigrants from Dominica | Bhutanese |
| Minimum | 88.8% | 94.4% |
| Maximum | 100.0% | 100.0% |
| Range | 11.2% | 5.6% |
| Mean | 97.4% | 98.7% |
| Median | 97.5% | 98.9% |
| Interquartile 25% (IQ1) | 96.3% | 98.4% |
| Interquartile 75% (IQ3) | 99.0% | 99.5% |
| Interquartile Range (IQR) | 2.6% | 1.1% |
| Standard Deviation (Sample) | 2.1% | 1.1% |
| Standard Deviation (Population) | 2.1% | 1.1% |
Similar Demographics by 3rd Grade
Demographics Similar to Immigrants from Dominica by 3rd Grade
In terms of 3rd grade, the demographic groups most similar to Immigrants from Dominica are Haitian (96.9%, a difference of 0.0%), Somali (96.8%, a difference of 0.010%), Immigrants from South Eastern Asia (96.8%, a difference of 0.020%), Immigrants (96.9%, a difference of 0.030%), and Immigrants from Cuba (96.8%, a difference of 0.030%).
| Demographics | Rating | Rank | 3rd Grade |
| Immigrants | Afghanistan | 0.0 /100 | #291 | Tragic 97.0% |
| British West Indians | 0.0 /100 | #292 | Tragic 97.0% |
| Immigrants | Grenada | 0.0 /100 | #293 | Tragic 97.0% |
| Malaysians | 0.0 /100 | #294 | Tragic 97.0% |
| Immigrants | Eritrea | 0.0 /100 | #295 | Tragic 97.0% |
| Immigrants | Immigrants | 0.0 /100 | #296 | Tragic 96.9% |
| Haitians | 0.0 /100 | #297 | Tragic 96.9% |
| Immigrants | Dominica | 0.0 /100 | #298 | Tragic 96.9% |
| Somalis | 0.0 /100 | #299 | Tragic 96.8% |
| Immigrants | South Eastern Asia | 0.0 /100 | #300 | Tragic 96.8% |
| Immigrants | Cuba | 0.0 /100 | #301 | Tragic 96.8% |
| Immigrants | Somalia | 0.0 /100 | #302 | Tragic 96.8% |
| Ecuadorians | 0.0 /100 | #303 | Tragic 96.7% |
| Immigrants | Caribbean | 0.0 /100 | #304 | Tragic 96.7% |
| Central American Indians | 0.0 /100 | #305 | Tragic 96.7% |
Demographics Similar to Bhutanese by 3rd Grade
In terms of 3rd grade, the demographic groups most similar to Bhutanese are German Russian (98.1%, a difference of 0.0%), Turkish (98.1%, a difference of 0.010%), Immigrants from Czechoslovakia (98.0%, a difference of 0.010%), Immigrants from Singapore (98.0%, a difference of 0.010%), and Pima (98.0%, a difference of 0.010%).
| Demographics | Rating | Rank | 3rd Grade |
| Romanians | 98.0 /100 | #99 | Exceptional 98.1% |
| Cree | 97.9 /100 | #100 | Exceptional 98.1% |
| Puget Sound Salish | 97.9 /100 | #101 | Exceptional 98.1% |
| Immigrants | Nonimmigrants | 97.8 /100 | #102 | Exceptional 98.1% |
| Yugoslavians | 97.7 /100 | #103 | Exceptional 98.1% |
| Turks | 97.6 /100 | #104 | Exceptional 98.1% |
| German Russians | 97.2 /100 | #105 | Exceptional 98.1% |
| Bhutanese | 97.2 /100 | #106 | Exceptional 98.1% |
| Immigrants | Czechoslovakia | 97.0 /100 | #107 | Exceptional 98.0% |
| Immigrants | Singapore | 96.7 /100 | #108 | Exceptional 98.0% |
| Pima | 96.7 /100 | #109 | Exceptional 98.0% |
| Immigrants | Switzerland | 96.6 /100 | #110 | Exceptional 98.0% |
| Basques | 96.5 /100 | #111 | Exceptional 98.0% |
| Immigrants | Latvia | 96.0 /100 | #112 | Exceptional 98.0% |
| Thais | 95.5 /100 | #113 | Exceptional 98.0% |