Immigrants from Dominica vs Potawatomi 3rd Grade
COMPARE
Immigrants from Dominica
Potawatomi
3rd Grade
3rd Grade Comparison
Immigrants from Dominica
Potawatomi
96.9%
3RD GRADE
0.0/ 100
METRIC RATING
298th/ 347
METRIC RANK
98.1%
3RD GRADE
98.9/ 100
METRIC RATING
86th/ 347
METRIC RANK
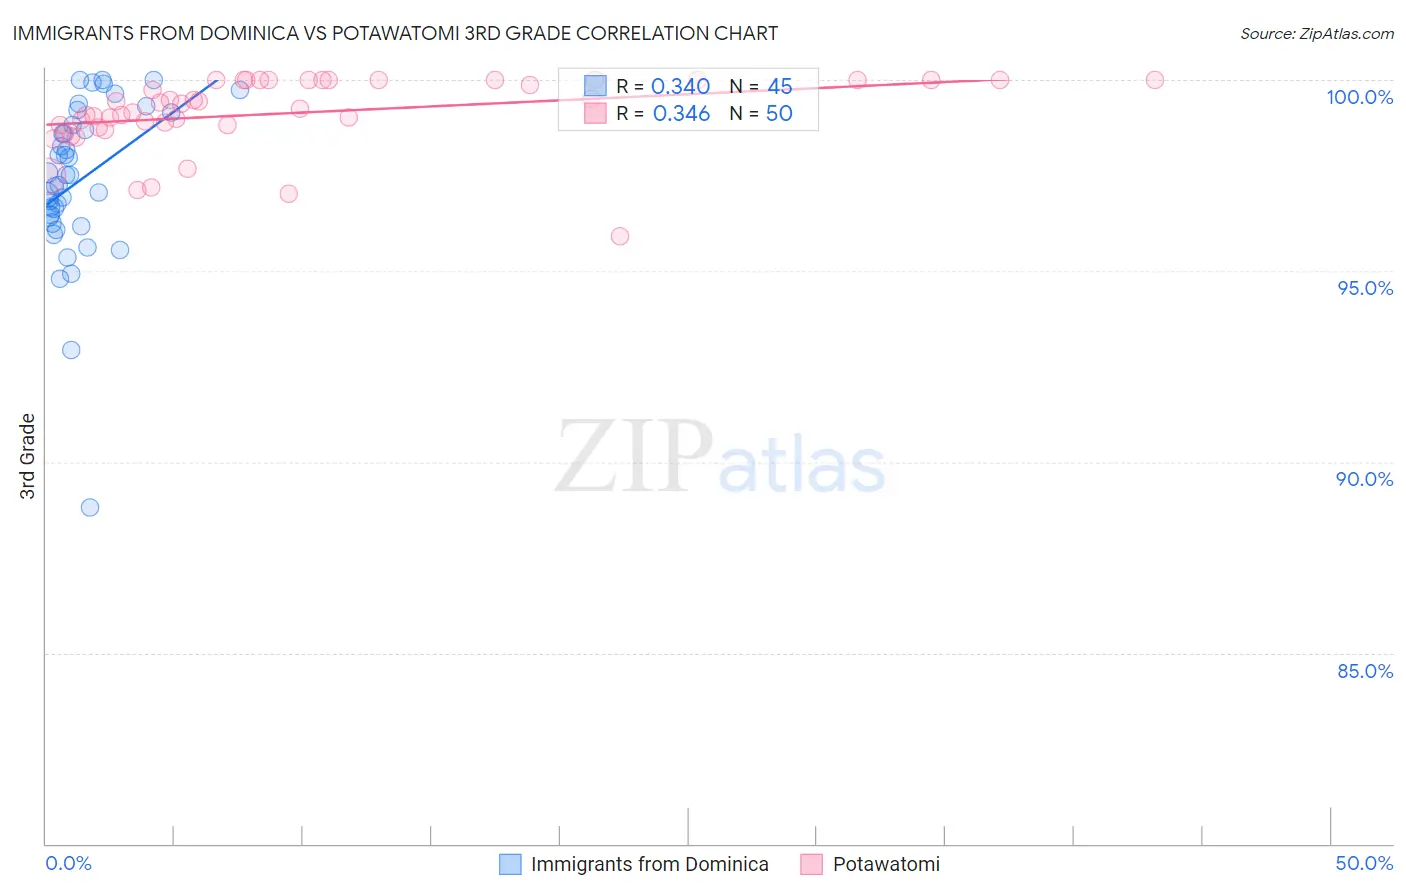
Immigrants from Dominica vs Potawatomi 3rd Grade Correlation Chart
The statistical analysis conducted on geographies consisting of 83,794,115 people shows a mild positive correlation between the proportion of Immigrants from Dominica and percentage of population with at least 3rd grade education in the United States with a correlation coefficient (R) of 0.340 and weighted average of 96.9%. Similarly, the statistical analysis conducted on geographies consisting of 117,769,196 people shows a mild positive correlation between the proportion of Potawatomi and percentage of population with at least 3rd grade education in the United States with a correlation coefficient (R) of 0.346 and weighted average of 98.1%, a difference of 1.3%.
3rd Grade Correlation Summary
| Measurement | Immigrants from Dominica | Potawatomi |
| Minimum | 88.8% | 95.9% |
| Maximum | 100.0% | 100.0% |
| Range | 11.2% | 4.1% |
| Mean | 97.4% | 99.1% |
| Median | 97.5% | 99.3% |
| Interquartile 25% (IQ1) | 96.3% | 98.8% |
| Interquartile 75% (IQ3) | 99.0% | 100.0% |
| Interquartile Range (IQR) | 2.6% | 1.2% |
| Standard Deviation (Sample) | 2.1% | 0.94% |
| Standard Deviation (Population) | 2.1% | 0.93% |
Similar Demographics by 3rd Grade
Demographics Similar to Immigrants from Dominica by 3rd Grade
In terms of 3rd grade, the demographic groups most similar to Immigrants from Dominica are Haitian (96.9%, a difference of 0.0%), Somali (96.8%, a difference of 0.010%), Immigrants from South Eastern Asia (96.8%, a difference of 0.020%), Immigrants (96.9%, a difference of 0.030%), and Immigrants from Cuba (96.8%, a difference of 0.030%).
| Demographics | Rating | Rank | 3rd Grade |
| Immigrants | Afghanistan | 0.0 /100 | #291 | Tragic 97.0% |
| British West Indians | 0.0 /100 | #292 | Tragic 97.0% |
| Immigrants | Grenada | 0.0 /100 | #293 | Tragic 97.0% |
| Malaysians | 0.0 /100 | #294 | Tragic 97.0% |
| Immigrants | Eritrea | 0.0 /100 | #295 | Tragic 97.0% |
| Immigrants | Immigrants | 0.0 /100 | #296 | Tragic 96.9% |
| Haitians | 0.0 /100 | #297 | Tragic 96.9% |
| Immigrants | Dominica | 0.0 /100 | #298 | Tragic 96.9% |
| Somalis | 0.0 /100 | #299 | Tragic 96.8% |
| Immigrants | South Eastern Asia | 0.0 /100 | #300 | Tragic 96.8% |
| Immigrants | Cuba | 0.0 /100 | #301 | Tragic 96.8% |
| Immigrants | Somalia | 0.0 /100 | #302 | Tragic 96.8% |
| Ecuadorians | 0.0 /100 | #303 | Tragic 96.7% |
| Immigrants | Caribbean | 0.0 /100 | #304 | Tragic 96.7% |
| Central American Indians | 0.0 /100 | #305 | Tragic 96.7% |
Demographics Similar to Potawatomi by 3rd Grade
In terms of 3rd grade, the demographic groups most similar to Potawatomi are Immigrants from Sweden (98.1%, a difference of 0.0%), Immigrants from Australia (98.1%, a difference of 0.0%), Immigrants from Denmark (98.1%, a difference of 0.0%), Immigrants from India (98.1%, a difference of 0.0%), and Delaware (98.1%, a difference of 0.0%).
| Demographics | Rating | Rank | 3rd Grade |
| Immigrants | Belgium | 99.1 /100 | #79 | Exceptional 98.1% |
| Macedonians | 99.1 /100 | #80 | Exceptional 98.1% |
| Icelanders | 99.1 /100 | #81 | Exceptional 98.1% |
| Shoshone | 99.0 /100 | #82 | Exceptional 98.1% |
| Ukrainians | 98.9 /100 | #83 | Exceptional 98.1% |
| Immigrants | Sweden | 98.9 /100 | #84 | Exceptional 98.1% |
| Immigrants | Australia | 98.9 /100 | #85 | Exceptional 98.1% |
| Potawatomi | 98.9 /100 | #86 | Exceptional 98.1% |
| Immigrants | Denmark | 98.8 /100 | #87 | Exceptional 98.1% |
| Immigrants | India | 98.8 /100 | #88 | Exceptional 98.1% |
| Delaware | 98.8 /100 | #89 | Exceptional 98.1% |
| Zimbabweans | 98.8 /100 | #90 | Exceptional 98.1% |
| Hopi | 98.7 /100 | #91 | Exceptional 98.1% |
| Immigrants | South Africa | 98.7 /100 | #92 | Exceptional 98.1% |
| Immigrants | Western Europe | 98.7 /100 | #93 | Exceptional 98.1% |