Immigrants from Dominica vs Barbadian 3rd Grade
COMPARE
Immigrants from Dominica
Barbadian
3rd Grade
3rd Grade Comparison
Immigrants from Dominica
Barbadians
96.9%
3RD GRADE
0.0/ 100
METRIC RATING
298th/ 347
METRIC RANK
97.2%
3RD GRADE
0.1/ 100
METRIC RATING
281st/ 347
METRIC RANK
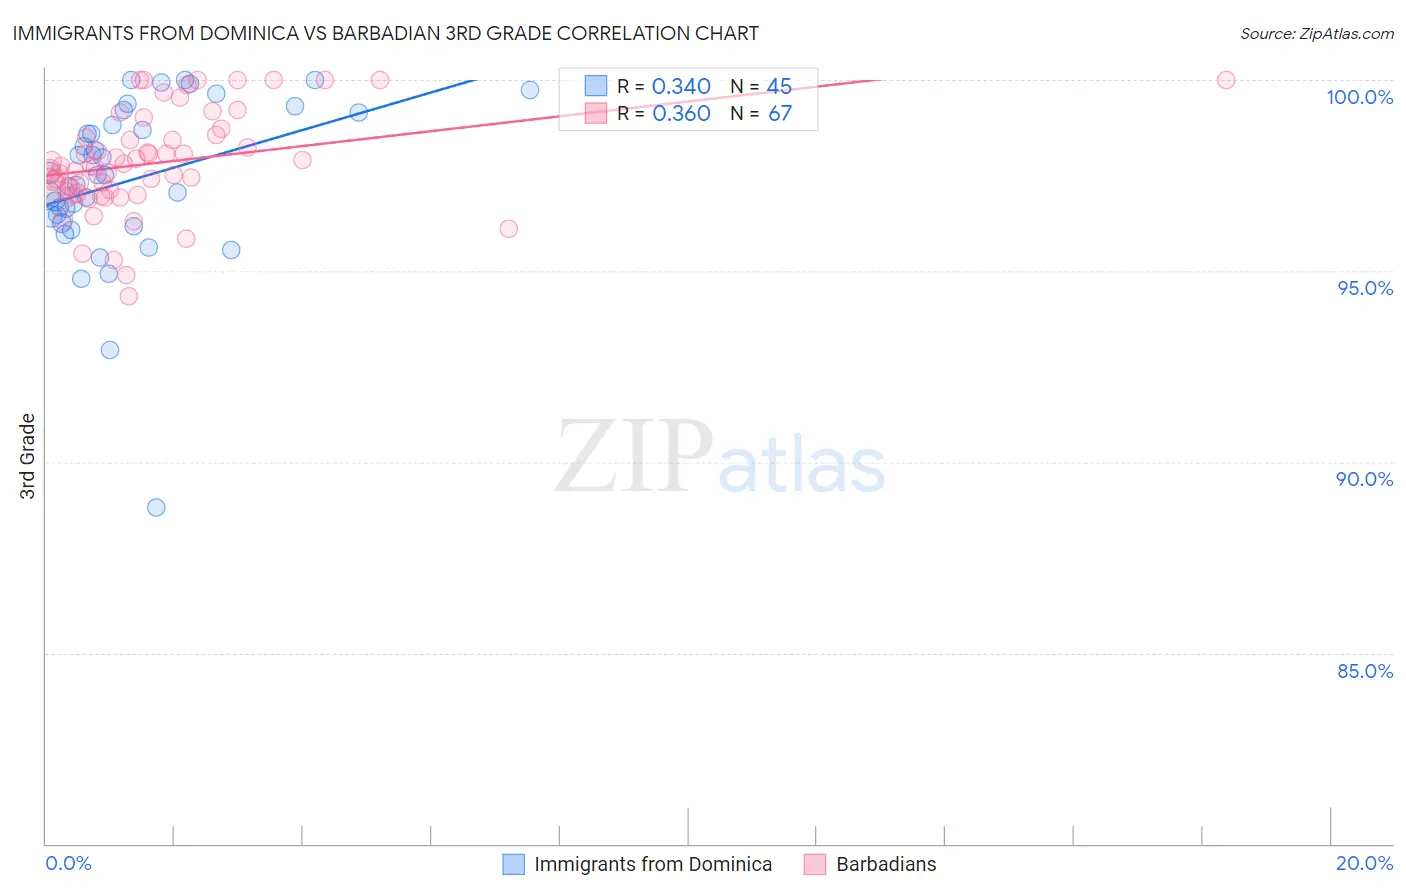
Immigrants from Dominica vs Barbadian 3rd Grade Correlation Chart
The statistical analysis conducted on geographies consisting of 83,794,115 people shows a mild positive correlation between the proportion of Immigrants from Dominica and percentage of population with at least 3rd grade education in the United States with a correlation coefficient (R) of 0.340 and weighted average of 96.9%. Similarly, the statistical analysis conducted on geographies consisting of 141,304,590 people shows a mild positive correlation between the proportion of Barbadians and percentage of population with at least 3rd grade education in the United States with a correlation coefficient (R) of 0.360 and weighted average of 97.2%, a difference of 0.31%.
3rd Grade Correlation Summary
| Measurement | Immigrants from Dominica | Barbadian |
| Minimum | 88.8% | 94.3% |
| Maximum | 100.0% | 100.0% |
| Range | 11.2% | 5.7% |
| Mean | 97.4% | 97.8% |
| Median | 97.5% | 97.7% |
| Interquartile 25% (IQ1) | 96.3% | 97.0% |
| Interquartile 75% (IQ3) | 99.0% | 98.6% |
| Interquartile Range (IQR) | 2.6% | 1.5% |
| Standard Deviation (Sample) | 2.1% | 1.3% |
| Standard Deviation (Population) | 2.1% | 1.3% |
Demographics Similar to Immigrants from Dominica and Barbadians by 3rd Grade
In terms of 3rd grade, the demographic groups most similar to Immigrants from Dominica are Haitian (96.9%, a difference of 0.0%), Somali (96.8%, a difference of 0.010%), Immigrants (96.9%, a difference of 0.030%), Immigrants from Eritrea (97.0%, a difference of 0.13%), and Malaysian (97.0%, a difference of 0.14%). Similarly, the demographic groups most similar to Barbadians are Immigrants from Philippines (97.2%, a difference of 0.010%), Immigrants from Ghana (97.2%, a difference of 0.010%), Afghan (97.1%, a difference of 0.010%), Houma (97.1%, a difference of 0.020%), and Immigrants from Trinidad and Tobago (97.1%, a difference of 0.030%).
| Demographics | Rating | Rank | 3rd Grade |
| Immigrants | Philippines | 0.1 /100 | #279 | Tragic 97.2% |
| Immigrants | Ghana | 0.1 /100 | #280 | Tragic 97.2% |
| Barbadians | 0.1 /100 | #281 | Tragic 97.2% |
| Afghans | 0.1 /100 | #282 | Tragic 97.1% |
| Houma | 0.1 /100 | #283 | Tragic 97.1% |
| Immigrants | Trinidad and Tobago | 0.0 /100 | #284 | Tragic 97.1% |
| Immigrants | Hong Kong | 0.0 /100 | #285 | Tragic 97.1% |
| Immigrants | Barbados | 0.0 /100 | #286 | Tragic 97.1% |
| Immigrants | St. Vincent and the Grenadines | 0.0 /100 | #287 | Tragic 97.1% |
| Immigrants | West Indies | 0.0 /100 | #288 | Tragic 97.1% |
| Immigrants | Thailand | 0.0 /100 | #289 | Tragic 97.1% |
| Immigrants | Portugal | 0.0 /100 | #290 | Tragic 97.0% |
| Immigrants | Afghanistan | 0.0 /100 | #291 | Tragic 97.0% |
| British West Indians | 0.0 /100 | #292 | Tragic 97.0% |
| Immigrants | Grenada | 0.0 /100 | #293 | Tragic 97.0% |
| Malaysians | 0.0 /100 | #294 | Tragic 97.0% |
| Immigrants | Eritrea | 0.0 /100 | #295 | Tragic 97.0% |
| Immigrants | Immigrants | 0.0 /100 | #296 | Tragic 96.9% |
| Haitians | 0.0 /100 | #297 | Tragic 96.9% |
| Immigrants | Dominica | 0.0 /100 | #298 | Tragic 96.9% |
| Somalis | 0.0 /100 | #299 | Tragic 96.8% |