Immigrants from Croatia vs Immigrants from South Eastern Asia Professional Degree
COMPARE
Immigrants from Croatia
Immigrants from South Eastern Asia
Professional Degree
Professional Degree Comparison
Immigrants from Croatia
Immigrants from South Eastern Asia
5.3%
PROFESSIONAL DEGREE
99.6/ 100
METRIC RATING
84th/ 347
METRIC RANK
4.0%
PROFESSIONAL DEGREE
8.9/ 100
METRIC RATING
219th/ 347
METRIC RANK
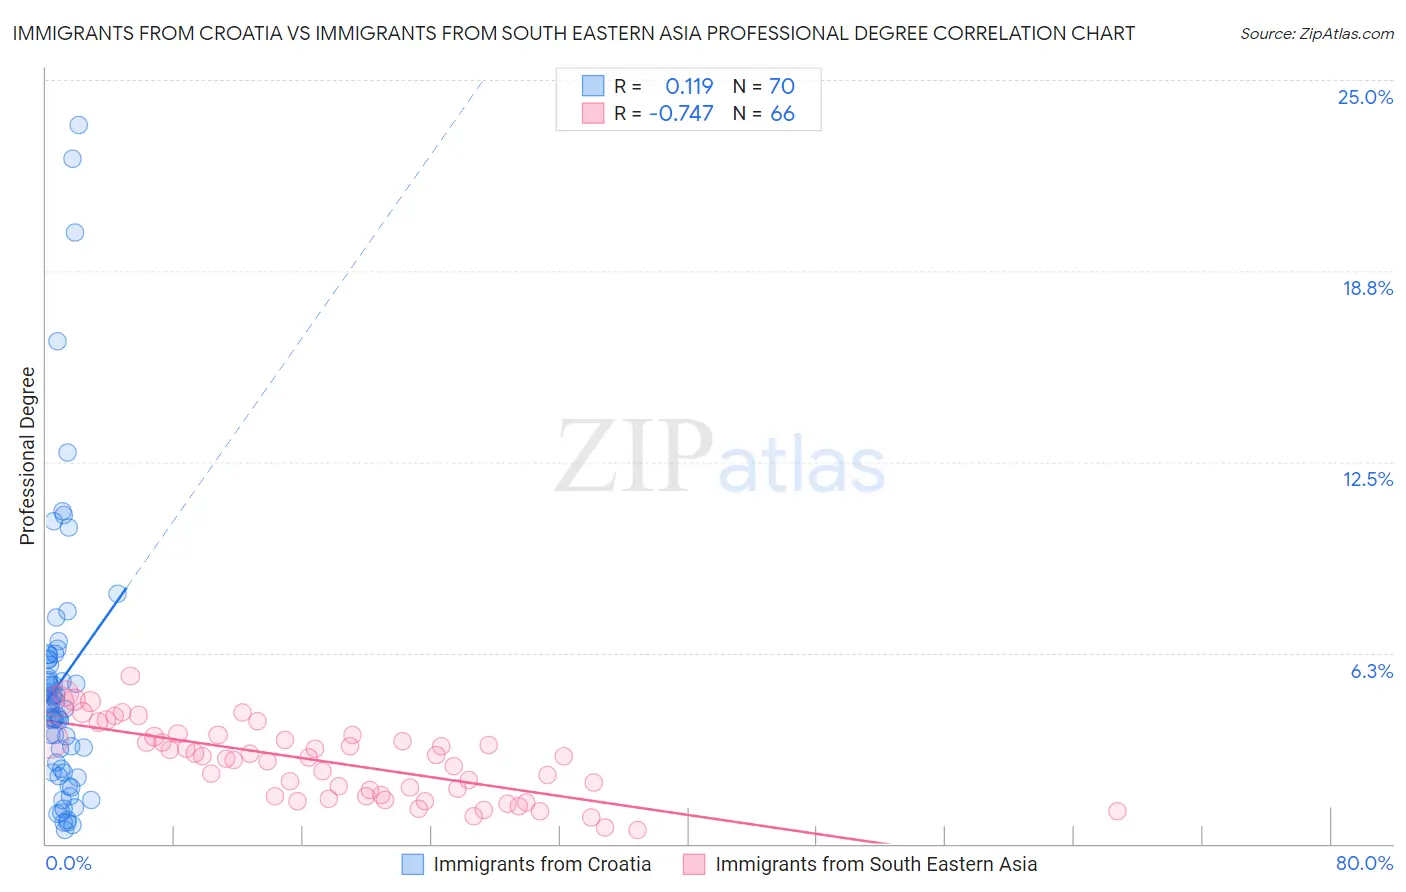
Immigrants from Croatia vs Immigrants from South Eastern Asia Professional Degree Correlation Chart
The statistical analysis conducted on geographies consisting of 132,543,380 people shows a poor positive correlation between the proportion of Immigrants from Croatia and percentage of population with at least professional degree education in the United States with a correlation coefficient (R) of 0.119 and weighted average of 5.3%. Similarly, the statistical analysis conducted on geographies consisting of 509,935,466 people shows a strong negative correlation between the proportion of Immigrants from South Eastern Asia and percentage of population with at least professional degree education in the United States with a correlation coefficient (R) of -0.747 and weighted average of 4.0%, a difference of 30.7%.
Professional Degree Correlation Summary
| Measurement | Immigrants from Croatia | Immigrants from South Eastern Asia |
| Minimum | 0.47% | 0.44% |
| Maximum | 23.5% | 5.5% |
| Range | 23.1% | 5.0% |
| Mean | 5.3% | 2.7% |
| Median | 4.5% | 2.8% |
| Interquartile 25% (IQ1) | 2.3% | 1.6% |
| Interquartile 75% (IQ3) | 6.1% | 3.5% |
| Interquartile Range (IQR) | 3.7% | 1.9% |
| Standard Deviation (Sample) | 4.7% | 1.2% |
| Standard Deviation (Population) | 4.6% | 1.2% |
Similar Demographics by Professional Degree
Demographics Similar to Immigrants from Croatia by Professional Degree
In terms of professional degree, the demographic groups most similar to Immigrants from Croatia are Carpatho Rusyn (5.3%, a difference of 0.0%), Immigrants from Zimbabwe (5.3%, a difference of 0.020%), Greek (5.3%, a difference of 0.020%), Immigrants from Chile (5.3%, a difference of 0.13%), and Romanian (5.3%, a difference of 0.20%).
| Demographics | Rating | Rank | Professional Degree |
| Immigrants | Ethiopia | 99.7 /100 | #77 | Exceptional 5.3% |
| Armenians | 99.7 /100 | #78 | Exceptional 5.3% |
| Immigrants | North America | 99.7 /100 | #79 | Exceptional 5.3% |
| Immigrants | England | 99.6 /100 | #80 | Exceptional 5.3% |
| Immigrants | Brazil | 99.6 /100 | #81 | Exceptional 5.3% |
| Romanians | 99.6 /100 | #82 | Exceptional 5.3% |
| Carpatho Rusyns | 99.6 /100 | #83 | Exceptional 5.3% |
| Immigrants | Croatia | 99.6 /100 | #84 | Exceptional 5.3% |
| Immigrants | Zimbabwe | 99.6 /100 | #85 | Exceptional 5.3% |
| Greeks | 99.6 /100 | #86 | Exceptional 5.3% |
| Immigrants | Chile | 99.5 /100 | #87 | Exceptional 5.3% |
| Egyptians | 99.5 /100 | #88 | Exceptional 5.3% |
| Chileans | 99.5 /100 | #89 | Exceptional 5.3% |
| Immigrants | Scotland | 99.5 /100 | #90 | Exceptional 5.3% |
| Laotians | 99.5 /100 | #91 | Exceptional 5.2% |
Demographics Similar to Immigrants from South Eastern Asia by Professional Degree
In terms of professional degree, the demographic groups most similar to Immigrants from South Eastern Asia are Dutch (4.0%, a difference of 0.030%), Immigrants from Vietnam (4.0%, a difference of 0.24%), Ute (4.0%, a difference of 0.35%), West Indian (4.1%, a difference of 0.40%), and French Canadian (4.0%, a difference of 0.49%).
| Demographics | Rating | Rank | Professional Degree |
| Whites/Caucasians | 11.2 /100 | #212 | Poor 4.1% |
| Koreans | 10.7 /100 | #213 | Poor 4.1% |
| Immigrants | Ghana | 10.6 /100 | #214 | Poor 4.1% |
| Portuguese | 10.5 /100 | #215 | Poor 4.1% |
| West Indians | 9.8 /100 | #216 | Tragic 4.1% |
| Immigrants | Vietnam | 9.4 /100 | #217 | Tragic 4.0% |
| Dutch | 9.0 /100 | #218 | Tragic 4.0% |
| Immigrants | South Eastern Asia | 8.9 /100 | #219 | Tragic 4.0% |
| Ute | 8.2 /100 | #220 | Tragic 4.0% |
| French Canadians | 8.0 /100 | #221 | Tragic 4.0% |
| Immigrants | Western Africa | 7.5 /100 | #222 | Tragic 4.0% |
| Immigrants | Bosnia and Herzegovina | 7.4 /100 | #223 | Tragic 4.0% |
| Trinidadians and Tobagonians | 7.1 /100 | #224 | Tragic 4.0% |
| Tlingit-Haida | 6.9 /100 | #225 | Tragic 4.0% |
| German Russians | 6.1 /100 | #226 | Tragic 4.0% |