Immigrants from Croatia vs Immigrants from Israel 2nd Grade
COMPARE
Immigrants from Croatia
Immigrants from Israel
2nd Grade
2nd Grade Comparison
Immigrants from Croatia
Immigrants from Israel
98.1%
2ND GRADE
92.1/ 100
METRIC RATING
129th/ 347
METRIC RANK
98.0%
2ND GRADE
78.0/ 100
METRIC RATING
146th/ 347
METRIC RANK
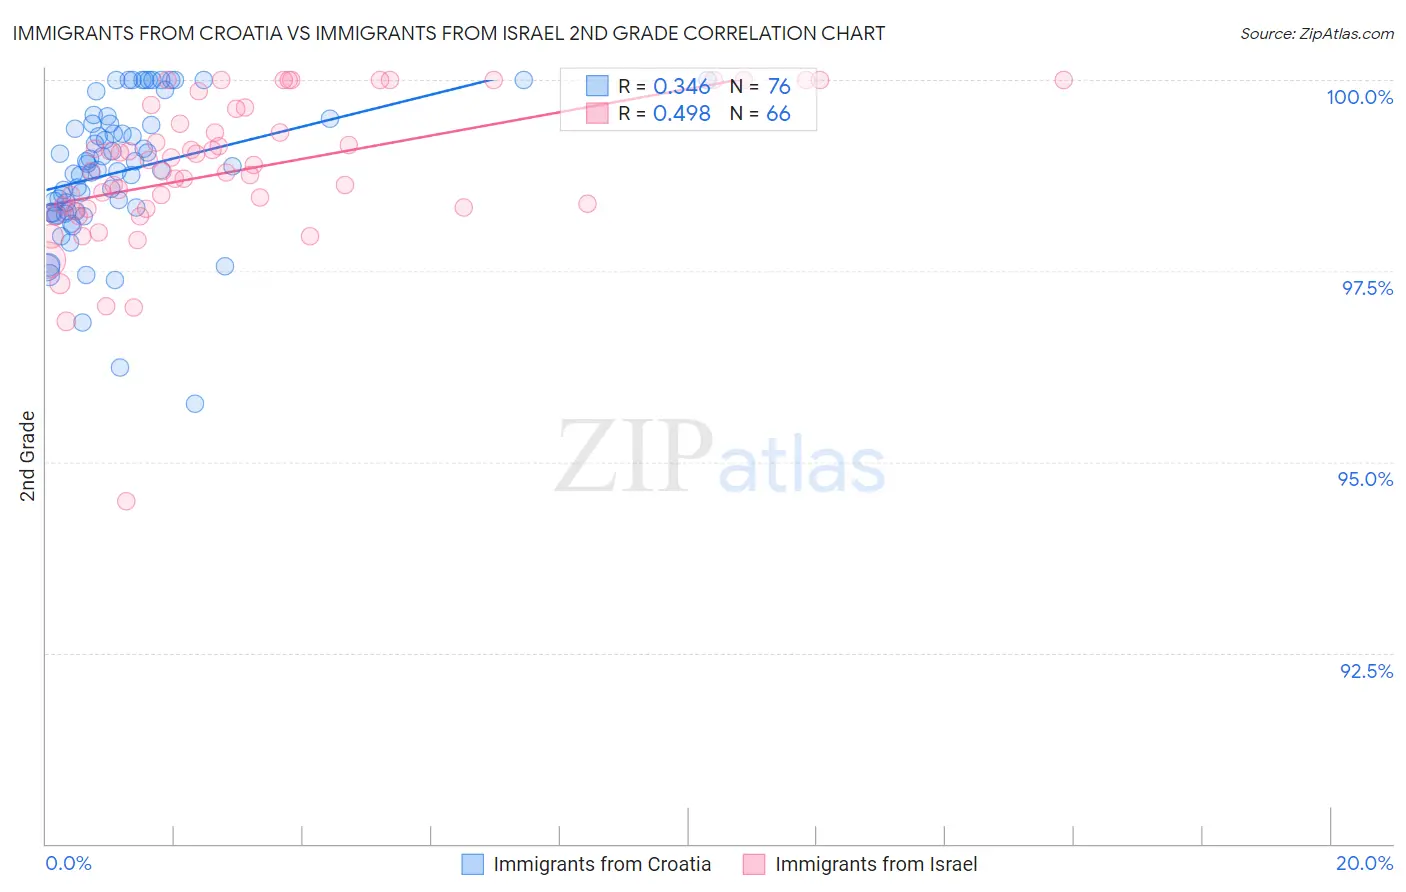
Immigrants from Croatia vs Immigrants from Israel 2nd Grade Correlation Chart
The statistical analysis conducted on geographies consisting of 132,538,077 people shows a mild positive correlation between the proportion of Immigrants from Croatia and percentage of population with at least 2nd grade education in the United States with a correlation coefficient (R) of 0.346 and weighted average of 98.1%. Similarly, the statistical analysis conducted on geographies consisting of 210,029,773 people shows a moderate positive correlation between the proportion of Immigrants from Israel and percentage of population with at least 2nd grade education in the United States with a correlation coefficient (R) of 0.498 and weighted average of 98.0%, a difference of 0.090%.
2nd Grade Correlation Summary
| Measurement | Immigrants from Croatia | Immigrants from Israel |
| Minimum | 95.8% | 94.5% |
| Maximum | 100.0% | 100.0% |
| Range | 4.2% | 5.5% |
| Mean | 98.8% | 98.8% |
| Median | 98.9% | 98.8% |
| Interquartile 25% (IQ1) | 98.3% | 98.3% |
| Interquartile 75% (IQ3) | 99.4% | 99.6% |
| Interquartile Range (IQR) | 1.2% | 1.3% |
| Standard Deviation (Sample) | 0.91% | 0.98% |
| Standard Deviation (Population) | 0.90% | 0.97% |
Demographics Similar to Immigrants from Croatia and Immigrants from Israel by 2nd Grade
In terms of 2nd grade, the demographic groups most similar to Immigrants from Croatia are Immigrants from Serbia (98.1%, a difference of 0.0%), Seminole (98.0%, a difference of 0.010%), Immigrants from Europe (98.0%, a difference of 0.010%), Spaniard (98.0%, a difference of 0.010%), and Cambodian (98.0%, a difference of 0.010%). Similarly, the demographic groups most similar to Immigrants from Israel are Burmese (98.0%, a difference of 0.010%), Alsatian (98.0%, a difference of 0.010%), Hmong (98.0%, a difference of 0.010%), Filipino (98.0%, a difference of 0.010%), and Immigrants from Greece (98.0%, a difference of 0.010%).
| Demographics | Rating | Rank | 2nd Grade |
| Immigrants | Saudi Arabia | 93.6 /100 | #127 | Exceptional 98.1% |
| Immigrants | Serbia | 92.3 /100 | #128 | Exceptional 98.1% |
| Immigrants | Croatia | 92.1 /100 | #129 | Exceptional 98.1% |
| Seminole | 91.1 /100 | #130 | Exceptional 98.0% |
| Immigrants | Europe | 91.1 /100 | #131 | Exceptional 98.0% |
| Spaniards | 90.7 /100 | #132 | Exceptional 98.0% |
| Cambodians | 90.7 /100 | #133 | Exceptional 98.0% |
| Immigrants | Hungary | 89.7 /100 | #134 | Excellent 98.0% |
| Immigrants | Bulgaria | 89.7 /100 | #135 | Excellent 98.0% |
| Immigrants | Kuwait | 89.2 /100 | #136 | Excellent 98.0% |
| Immigrants | Romania | 88.3 /100 | #137 | Excellent 98.0% |
| Israelis | 87.9 /100 | #138 | Excellent 98.0% |
| Blackfeet | 87.5 /100 | #139 | Excellent 98.0% |
| Palestinians | 83.9 /100 | #140 | Excellent 98.0% |
| Immigrants | Turkey | 83.0 /100 | #141 | Excellent 98.0% |
| Burmese | 81.0 /100 | #142 | Excellent 98.0% |
| Alsatians | 80.5 /100 | #143 | Excellent 98.0% |
| Hmong | 80.0 /100 | #144 | Good 98.0% |
| Filipinos | 79.2 /100 | #145 | Good 98.0% |
| Immigrants | Israel | 78.0 /100 | #146 | Good 98.0% |
| Immigrants | Greece | 76.8 /100 | #147 | Good 98.0% |