French American Indian vs Icelander 9th Grade
COMPARE
French American Indian
Icelander
9th Grade
9th Grade Comparison
French American Indians
Icelanders
95.0%
9TH GRADE
66.5/ 100
METRIC RATING
161st/ 347
METRIC RANK
95.7%
9TH GRADE
99.1/ 100
METRIC RATING
85th/ 347
METRIC RANK
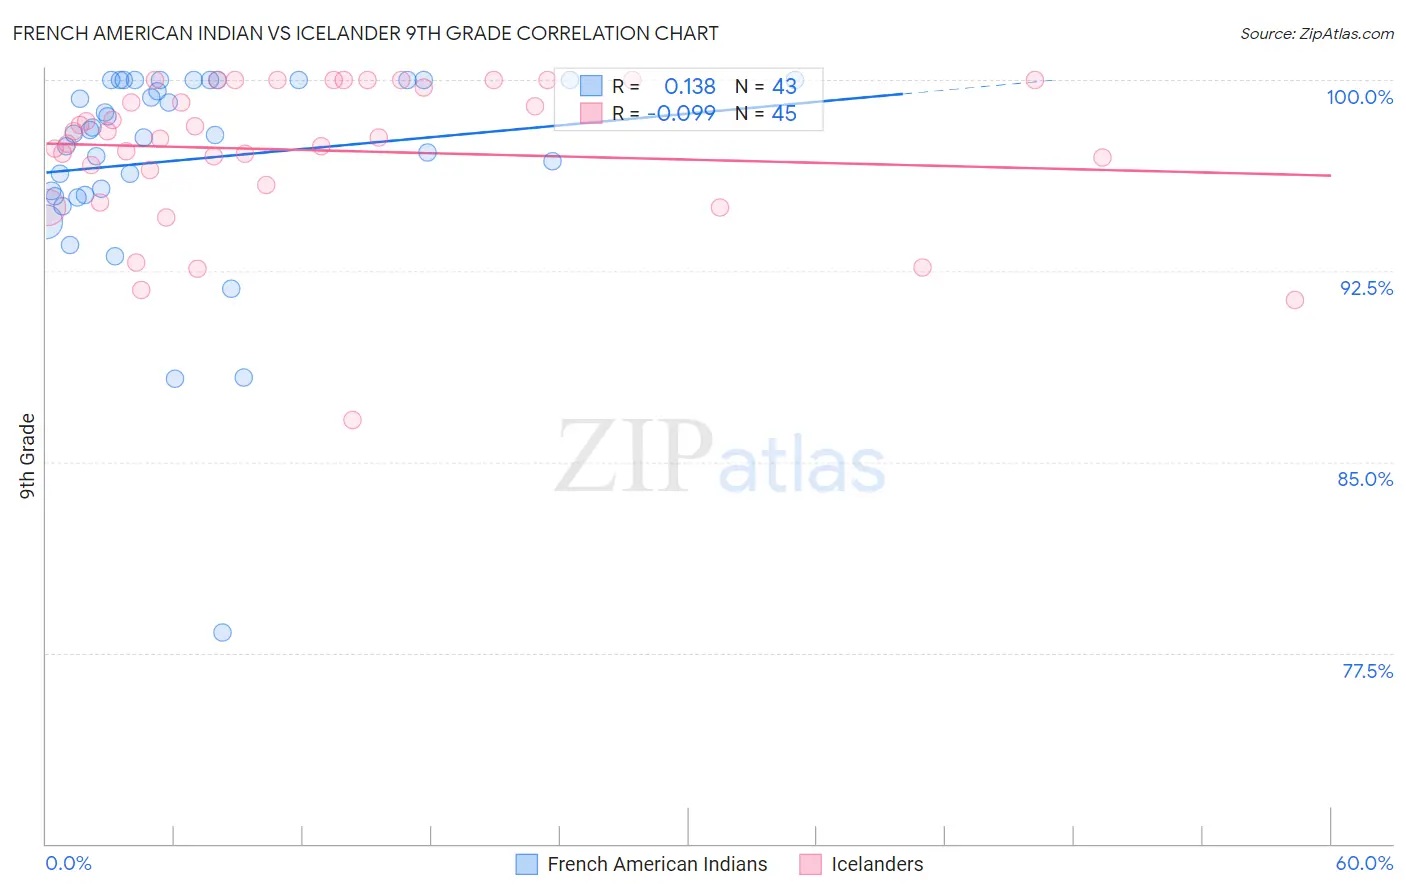
French American Indian vs Icelander 9th Grade Correlation Chart
The statistical analysis conducted on geographies consisting of 131,976,269 people shows a poor positive correlation between the proportion of French American Indians and percentage of population with at least 9th grade education in the United States with a correlation coefficient (R) of 0.138 and weighted average of 95.0%. Similarly, the statistical analysis conducted on geographies consisting of 159,667,064 people shows a slight negative correlation between the proportion of Icelanders and percentage of population with at least 9th grade education in the United States with a correlation coefficient (R) of -0.099 and weighted average of 95.7%, a difference of 0.74%.
9th Grade Correlation Summary
| Measurement | French American Indian | Icelander |
| Minimum | 78.3% | 86.7% |
| Maximum | 100.0% | 100.0% |
| Range | 21.7% | 13.3% |
| Mean | 96.9% | 97.2% |
| Median | 97.9% | 97.7% |
| Interquartile 25% (IQ1) | 95.5% | 96.2% |
| Interquartile 75% (IQ3) | 100.0% | 100.0% |
| Interquartile Range (IQR) | 4.5% | 3.8% |
| Standard Deviation (Sample) | 4.2% | 2.9% |
| Standard Deviation (Population) | 4.1% | 2.9% |
Similar Demographics by 9th Grade
Demographics Similar to French American Indians by 9th Grade
In terms of 9th grade, the demographic groups most similar to French American Indians are Immigrants from Italy (95.0%, a difference of 0.0%), Immigrants from Ukraine (95.0%, a difference of 0.010%), Bermudan (95.0%, a difference of 0.010%), Pakistani (95.0%, a difference of 0.020%), and Venezuelan (95.0%, a difference of 0.020%).
| Demographics | Rating | Rank | 9th Grade |
| Arabs | 74.9 /100 | #154 | Good 95.1% |
| Immigrants | Kazakhstan | 74.7 /100 | #155 | Good 95.1% |
| Immigrants | Kenya | 73.1 /100 | #156 | Good 95.0% |
| Mongolians | 73.0 /100 | #157 | Good 95.0% |
| Egyptians | 70.1 /100 | #158 | Good 95.0% |
| Immigrants | Ukraine | 67.4 /100 | #159 | Good 95.0% |
| Immigrants | Italy | 66.6 /100 | #160 | Good 95.0% |
| French American Indians | 66.5 /100 | #161 | Good 95.0% |
| Bermudans | 65.8 /100 | #162 | Good 95.0% |
| Pakistanis | 64.1 /100 | #163 | Good 95.0% |
| Venezuelans | 63.6 /100 | #164 | Good 95.0% |
| Blackfeet | 62.6 /100 | #165 | Good 95.0% |
| Ute | 62.6 /100 | #166 | Good 95.0% |
| Immigrants | Brazil | 61.1 /100 | #167 | Good 95.0% |
| Chileans | 60.7 /100 | #168 | Good 95.0% |
Demographics Similar to Icelanders by 9th Grade
In terms of 9th grade, the demographic groups most similar to Icelanders are Immigrants from Denmark (95.7%, a difference of 0.0%), Immigrants from Western Europe (95.7%, a difference of 0.0%), Swiss (95.7%, a difference of 0.010%), Bhutanese (95.7%, a difference of 0.030%), and Arapaho (95.7%, a difference of 0.030%).
| Demographics | Rating | Rank | 9th Grade |
| Immigrants | South Africa | 99.4 /100 | #78 | Exceptional 95.8% |
| Romanians | 99.3 /100 | #79 | Exceptional 95.7% |
| Bhutanese | 99.3 /100 | #80 | Exceptional 95.7% |
| Arapaho | 99.3 /100 | #81 | Exceptional 95.7% |
| Puget Sound Salish | 99.2 /100 | #82 | Exceptional 95.7% |
| Swiss | 99.2 /100 | #83 | Exceptional 95.7% |
| Immigrants | Denmark | 99.1 /100 | #84 | Exceptional 95.7% |
| Icelanders | 99.1 /100 | #85 | Exceptional 95.7% |
| Immigrants | Western Europe | 99.1 /100 | #86 | Exceptional 95.7% |
| Okinawans | 99.0 /100 | #87 | Exceptional 95.7% |
| Immigrants | Czechoslovakia | 98.9 /100 | #88 | Exceptional 95.7% |
| Yugoslavians | 98.9 /100 | #89 | Exceptional 95.7% |
| South Africans | 98.8 /100 | #90 | Exceptional 95.6% |
| Creek | 98.8 /100 | #91 | Exceptional 95.6% |
| Immigrants | Saudi Arabia | 98.8 /100 | #92 | Exceptional 95.6% |