Immigrants from Caribbean vs Icelander 9th Grade
COMPARE
Immigrants from Caribbean
Icelander
9th Grade
9th Grade Comparison
Immigrants from Caribbean
Icelanders
92.2%
9TH GRADE
0.0/ 100
METRIC RATING
315th/ 347
METRIC RANK
95.7%
9TH GRADE
99.1/ 100
METRIC RATING
85th/ 347
METRIC RANK
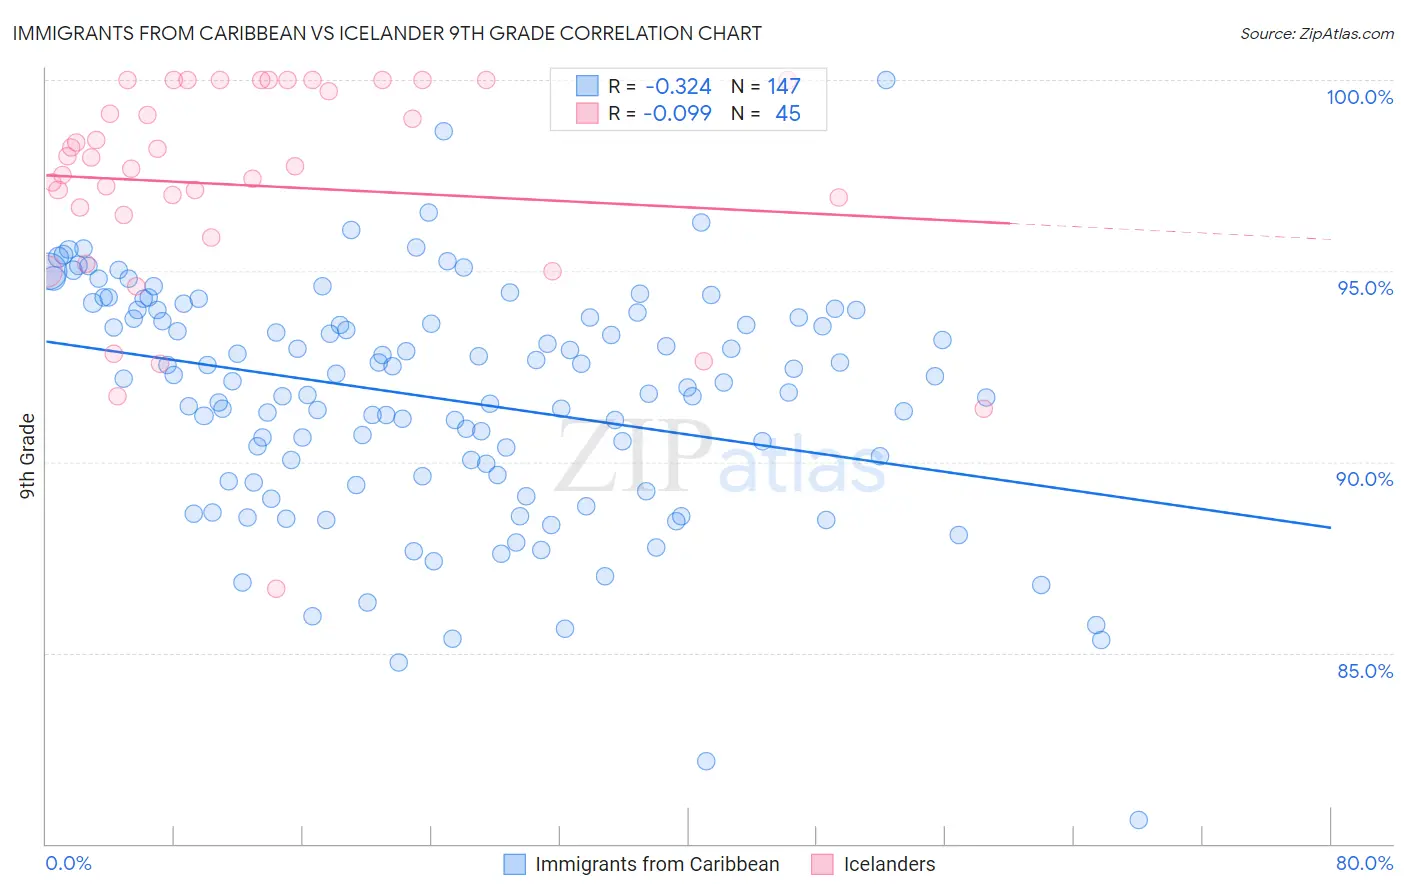
Immigrants from Caribbean vs Icelander 9th Grade Correlation Chart
The statistical analysis conducted on geographies consisting of 450,064,654 people shows a mild negative correlation between the proportion of Immigrants from Caribbean and percentage of population with at least 9th grade education in the United States with a correlation coefficient (R) of -0.324 and weighted average of 92.2%. Similarly, the statistical analysis conducted on geographies consisting of 159,667,064 people shows a slight negative correlation between the proportion of Icelanders and percentage of population with at least 9th grade education in the United States with a correlation coefficient (R) of -0.099 and weighted average of 95.7%, a difference of 3.8%.
9th Grade Correlation Summary
| Measurement | Immigrants from Caribbean | Icelander |
| Minimum | 80.6% | 86.7% |
| Maximum | 100.0% | 100.0% |
| Range | 19.4% | 13.3% |
| Mean | 91.6% | 97.2% |
| Median | 92.1% | 97.7% |
| Interquartile 25% (IQ1) | 89.6% | 96.2% |
| Interquartile 75% (IQ3) | 93.9% | 100.0% |
| Interquartile Range (IQR) | 4.3% | 3.8% |
| Standard Deviation (Sample) | 3.1% | 2.9% |
| Standard Deviation (Population) | 3.1% | 2.9% |
Similar Demographics by 9th Grade
Demographics Similar to Immigrants from Caribbean by 9th Grade
In terms of 9th grade, the demographic groups most similar to Immigrants from Caribbean are Immigrants from Portugal (92.2%, a difference of 0.010%), Cape Verdean (92.2%, a difference of 0.040%), Vietnamese (92.3%, a difference of 0.050%), Immigrants from Cuba (92.2%, a difference of 0.050%), and Houma (92.3%, a difference of 0.070%).
| Demographics | Rating | Rank | 9th Grade |
| Immigrants | Guyana | 0.0 /100 | #308 | Tragic 92.5% |
| Immigrants | Bangladesh | 0.0 /100 | #309 | Tragic 92.4% |
| Immigrants | Cambodia | 0.0 /100 | #310 | Tragic 92.4% |
| Immigrants | Fiji | 0.0 /100 | #311 | Tragic 92.3% |
| Houma | 0.0 /100 | #312 | Tragic 92.3% |
| Vietnamese | 0.0 /100 | #313 | Tragic 92.3% |
| Immigrants | Portugal | 0.0 /100 | #314 | Tragic 92.2% |
| Immigrants | Caribbean | 0.0 /100 | #315 | Tragic 92.2% |
| Cape Verdeans | 0.0 /100 | #316 | Tragic 92.2% |
| Immigrants | Cuba | 0.0 /100 | #317 | Tragic 92.2% |
| Nepalese | 0.0 /100 | #318 | Tragic 92.0% |
| Ecuadorians | 0.0 /100 | #319 | Tragic 91.9% |
| Nicaraguans | 0.0 /100 | #320 | Tragic 91.9% |
| Immigrants | Ecuador | 0.0 /100 | #321 | Tragic 91.8% |
| Belizeans | 0.0 /100 | #322 | Tragic 91.8% |
Demographics Similar to Icelanders by 9th Grade
In terms of 9th grade, the demographic groups most similar to Icelanders are Immigrants from Denmark (95.7%, a difference of 0.0%), Immigrants from Western Europe (95.7%, a difference of 0.0%), Swiss (95.7%, a difference of 0.010%), Bhutanese (95.7%, a difference of 0.030%), and Arapaho (95.7%, a difference of 0.030%).
| Demographics | Rating | Rank | 9th Grade |
| Immigrants | South Africa | 99.4 /100 | #78 | Exceptional 95.8% |
| Romanians | 99.3 /100 | #79 | Exceptional 95.7% |
| Bhutanese | 99.3 /100 | #80 | Exceptional 95.7% |
| Arapaho | 99.3 /100 | #81 | Exceptional 95.7% |
| Puget Sound Salish | 99.2 /100 | #82 | Exceptional 95.7% |
| Swiss | 99.2 /100 | #83 | Exceptional 95.7% |
| Immigrants | Denmark | 99.1 /100 | #84 | Exceptional 95.7% |
| Icelanders | 99.1 /100 | #85 | Exceptional 95.7% |
| Immigrants | Western Europe | 99.1 /100 | #86 | Exceptional 95.7% |
| Okinawans | 99.0 /100 | #87 | Exceptional 95.7% |
| Immigrants | Czechoslovakia | 98.9 /100 | #88 | Exceptional 95.7% |
| Yugoslavians | 98.9 /100 | #89 | Exceptional 95.7% |
| South Africans | 98.8 /100 | #90 | Exceptional 95.6% |
| Creek | 98.8 /100 | #91 | Exceptional 95.6% |
| Immigrants | Saudi Arabia | 98.8 /100 | #92 | Exceptional 95.6% |