Immigrants from Costa Rica vs Albanian Doctorate Degree
COMPARE
Immigrants from Costa Rica
Albanian
Doctorate Degree
Doctorate Degree Comparison
Immigrants from Costa Rica
Albanians
1.8%
DOCTORATE DEGREE
30.2/ 100
METRIC RATING
190th/ 347
METRIC RANK
1.9%
DOCTORATE DEGREE
74.8/ 100
METRIC RATING
151st/ 347
METRIC RANK
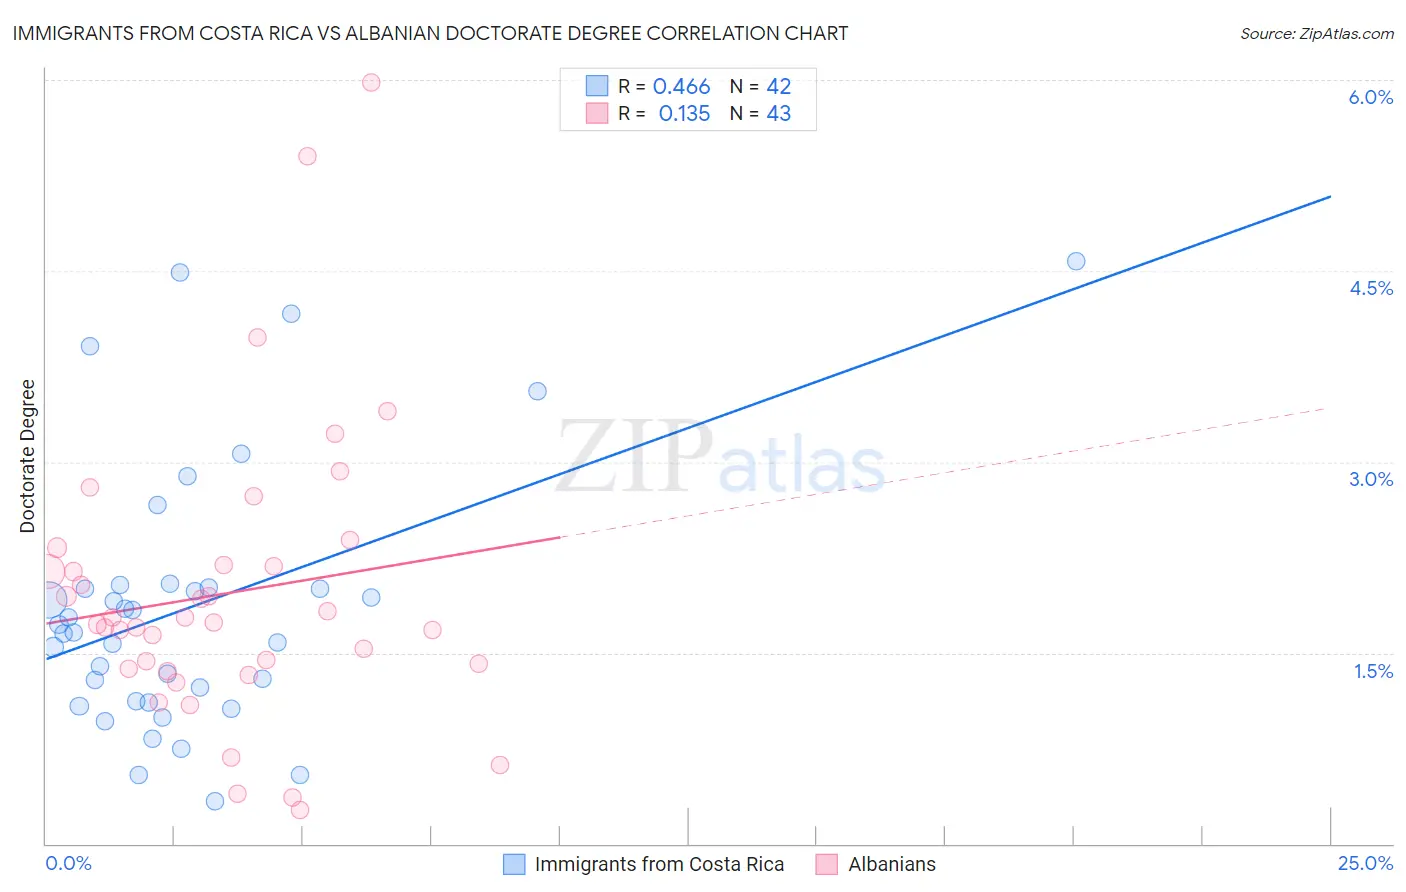
Immigrants from Costa Rica vs Albanian Doctorate Degree Correlation Chart
The statistical analysis conducted on geographies consisting of 203,508,401 people shows a moderate positive correlation between the proportion of Immigrants from Costa Rica and percentage of population with at least doctorate degree education in the United States with a correlation coefficient (R) of 0.466 and weighted average of 1.8%. Similarly, the statistical analysis conducted on geographies consisting of 192,567,939 people shows a poor positive correlation between the proportion of Albanians and percentage of population with at least doctorate degree education in the United States with a correlation coefficient (R) of 0.135 and weighted average of 1.9%, a difference of 7.3%.
Doctorate Degree Correlation Summary
| Measurement | Immigrants from Costa Rica | Albanian |
| Minimum | 0.34% | 0.26% |
| Maximum | 4.6% | 6.0% |
| Range | 4.2% | 5.7% |
| Mean | 1.9% | 2.0% |
| Median | 1.7% | 1.7% |
| Interquartile 25% (IQ1) | 1.1% | 1.4% |
| Interquartile 75% (IQ3) | 2.0% | 2.2% |
| Interquartile Range (IQR) | 0.89% | 0.81% |
| Standard Deviation (Sample) | 1.0% | 1.1% |
| Standard Deviation (Population) | 1.0% | 1.1% |
Similar Demographics by Doctorate Degree
Demographics Similar to Immigrants from Costa Rica by Doctorate Degree
In terms of doctorate degree, the demographic groups most similar to Immigrants from Costa Rica are French Canadian (1.8%, a difference of 0.020%), German (1.8%, a difference of 0.060%), South American (1.8%, a difference of 0.12%), Czechoslovakian (1.8%, a difference of 0.50%), and Dutch (1.8%, a difference of 0.51%).
| Demographics | Rating | Rank | Doctorate Degree |
| Finns | 42.1 /100 | #183 | Average 1.8% |
| Nigerians | 39.9 /100 | #184 | Fair 1.8% |
| Slovaks | 36.4 /100 | #185 | Fair 1.8% |
| Peruvians | 34.4 /100 | #186 | Fair 1.8% |
| Czechoslovakians | 33.0 /100 | #187 | Fair 1.8% |
| Germans | 30.5 /100 | #188 | Fair 1.8% |
| French Canadians | 30.2 /100 | #189 | Fair 1.8% |
| Immigrants | Costa Rica | 30.2 /100 | #190 | Fair 1.8% |
| South Americans | 29.5 /100 | #191 | Fair 1.8% |
| Dutch | 27.4 /100 | #192 | Fair 1.8% |
| German Russians | 27.1 /100 | #193 | Fair 1.8% |
| Uruguayans | 26.2 /100 | #194 | Fair 1.8% |
| Immigrants | Somalia | 25.4 /100 | #195 | Fair 1.8% |
| Sub-Saharan Africans | 25.1 /100 | #196 | Fair 1.8% |
| Chinese | 25.1 /100 | #197 | Fair 1.8% |
Demographics Similar to Albanians by Doctorate Degree
In terms of doctorate degree, the demographic groups most similar to Albanians are Immigrants from Kenya (1.9%, a difference of 0.10%), Immigrants from Oceania (1.9%, a difference of 0.15%), English (1.9%, a difference of 0.19%), Immigrants from Albania (1.9%, a difference of 0.37%), and Polish (1.9%, a difference of 0.39%).
| Demographics | Rating | Rank | Doctorate Degree |
| Immigrants | Moldova | 84.3 /100 | #144 | Excellent 2.0% |
| Kenyans | 83.6 /100 | #145 | Excellent 1.9% |
| Immigrants | Syria | 83.6 /100 | #146 | Excellent 1.9% |
| Immigrants | Senegal | 82.5 /100 | #147 | Excellent 1.9% |
| Luxembourgers | 81.1 /100 | #148 | Excellent 1.9% |
| Basques | 76.9 /100 | #149 | Good 1.9% |
| English | 75.9 /100 | #150 | Good 1.9% |
| Albanians | 74.8 /100 | #151 | Good 1.9% |
| Immigrants | Kenya | 74.3 /100 | #152 | Good 1.9% |
| Immigrants | Oceania | 74.0 /100 | #153 | Good 1.9% |
| Immigrants | Albania | 72.8 /100 | #154 | Good 1.9% |
| Poles | 72.7 /100 | #155 | Good 1.9% |
| Slavs | 72.4 /100 | #156 | Good 1.9% |
| Danes | 71.9 /100 | #157 | Good 1.9% |
| Hungarians | 71.7 /100 | #158 | Good 1.9% |