Immigrants from Eastern Asia vs British Doctorate Degree
COMPARE
Immigrants from Eastern Asia
British
Doctorate Degree
Doctorate Degree Comparison
Immigrants from Eastern Asia
British
3.0%
DOCTORATE DEGREE
100.0/ 100
METRIC RATING
10th/ 347
METRIC RANK
2.2%
DOCTORATE DEGREE
99.3/ 100
METRIC RATING
89th/ 347
METRIC RANK
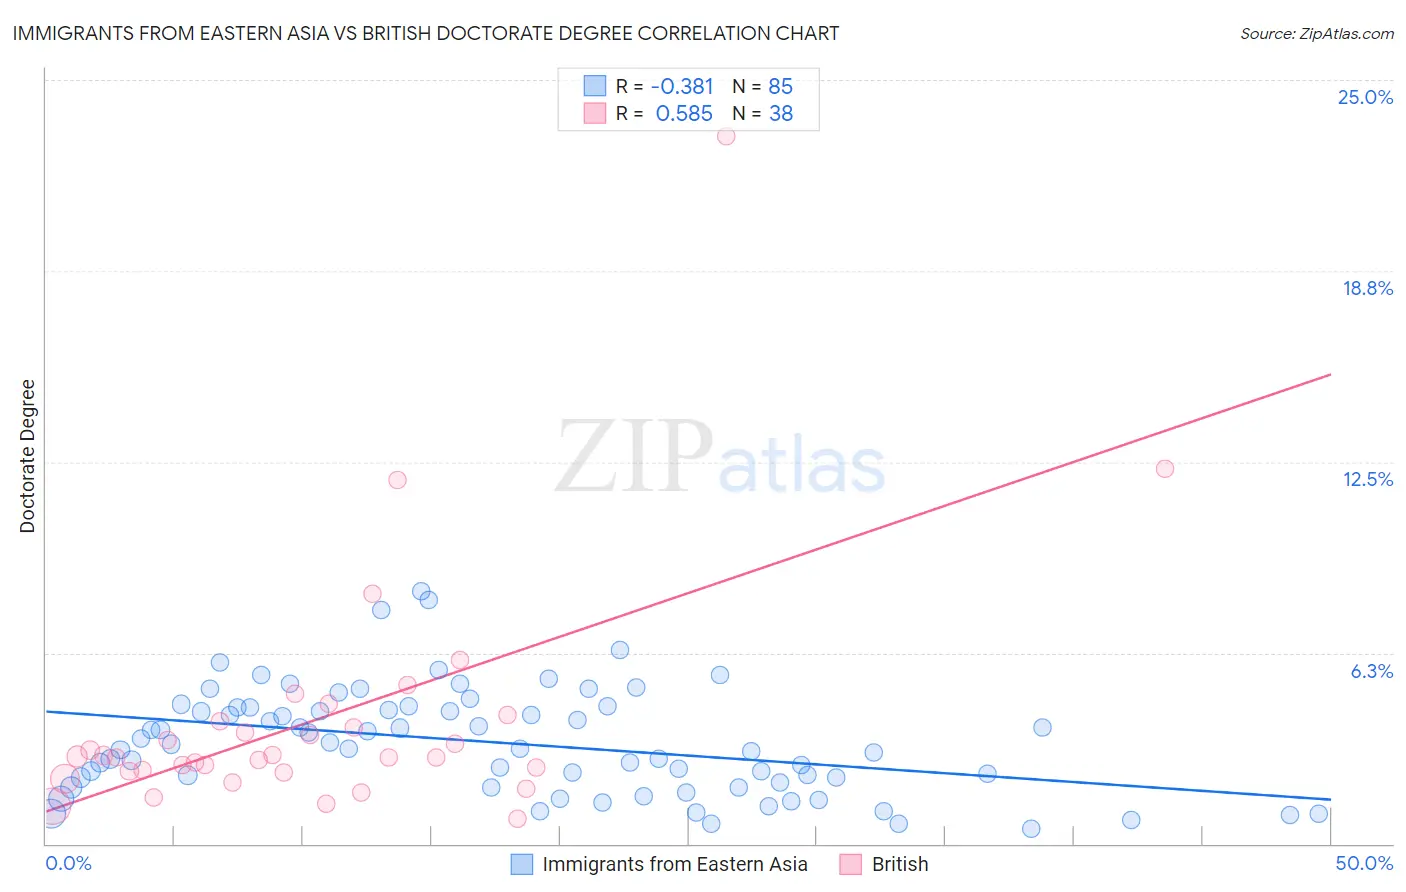
Immigrants from Eastern Asia vs British Doctorate Degree Correlation Chart
The statistical analysis conducted on geographies consisting of 492,135,301 people shows a mild negative correlation between the proportion of Immigrants from Eastern Asia and percentage of population with at least doctorate degree education in the United States with a correlation coefficient (R) of -0.381 and weighted average of 3.0%. Similarly, the statistical analysis conducted on geographies consisting of 517,011,664 people shows a substantial positive correlation between the proportion of British and percentage of population with at least doctorate degree education in the United States with a correlation coefficient (R) of 0.585 and weighted average of 2.2%, a difference of 36.7%.
Doctorate Degree Correlation Summary
| Measurement | Immigrants from Eastern Asia | British |
| Minimum | 0.51% | 0.83% |
| Maximum | 8.3% | 23.1% |
| Range | 7.7% | 22.3% |
| Mean | 3.3% | 4.1% |
| Median | 3.1% | 2.8% |
| Interquartile 25% (IQ1) | 1.9% | 2.4% |
| Interquartile 75% (IQ3) | 4.4% | 4.0% |
| Interquartile Range (IQR) | 2.5% | 1.6% |
| Standard Deviation (Sample) | 1.7% | 4.0% |
| Standard Deviation (Population) | 1.7% | 4.0% |
Similar Demographics by Doctorate Degree
Demographics Similar to Immigrants from Eastern Asia by Doctorate Degree
In terms of doctorate degree, the demographic groups most similar to Immigrants from Eastern Asia are Indian (Asian) (2.9%, a difference of 1.8%), Immigrants from Iran (3.0%, a difference of 2.1%), Immigrants from Belgium (2.9%, a difference of 2.5%), Immigrants from Israel (3.0%, a difference of 2.8%), and Immigrants from Sweden (2.9%, a difference of 3.5%).
| Demographics | Rating | Rank | Doctorate Degree |
| Okinawans | 100.0 /100 | #3 | Exceptional 3.3% |
| Immigrants | Taiwan | 100.0 /100 | #4 | Exceptional 3.2% |
| Iranians | 100.0 /100 | #5 | Exceptional 3.1% |
| Immigrants | Switzerland | 100.0 /100 | #6 | Exceptional 3.1% |
| Immigrants | China | 100.0 /100 | #7 | Exceptional 3.1% |
| Immigrants | Israel | 100.0 /100 | #8 | Exceptional 3.0% |
| Immigrants | Iran | 100.0 /100 | #9 | Exceptional 3.0% |
| Immigrants | Eastern Asia | 100.0 /100 | #10 | Exceptional 3.0% |
| Indians (Asian) | 100.0 /100 | #11 | Exceptional 2.9% |
| Immigrants | Belgium | 100.0 /100 | #12 | Exceptional 2.9% |
| Immigrants | Sweden | 100.0 /100 | #13 | Exceptional 2.9% |
| Immigrants | France | 100.0 /100 | #14 | Exceptional 2.9% |
| Immigrants | India | 100.0 /100 | #15 | Exceptional 2.8% |
| Eastern Europeans | 100.0 /100 | #16 | Exceptional 2.8% |
| Immigrants | Australia | 100.0 /100 | #17 | Exceptional 2.8% |
Demographics Similar to British by Doctorate Degree
In terms of doctorate degree, the demographic groups most similar to British are Immigrants from Scotland (2.2%, a difference of 0.020%), Immigrants from Nepal (2.2%, a difference of 0.44%), Immigrants from Sudan (2.2%, a difference of 0.49%), Chilean (2.2%, a difference of 0.75%), and Immigrants from Zimbabwe (2.2%, a difference of 0.80%).
| Demographics | Rating | Rank | Doctorate Degree |
| Immigrants | Uganda | 99.6 /100 | #82 | Exceptional 2.2% |
| Immigrants | Lithuania | 99.6 /100 | #83 | Exceptional 2.2% |
| Immigrants | England | 99.6 /100 | #84 | Exceptional 2.2% |
| Immigrants | Brazil | 99.6 /100 | #85 | Exceptional 2.2% |
| Egyptians | 99.4 /100 | #86 | Exceptional 2.2% |
| Immigrants | Zimbabwe | 99.4 /100 | #87 | Exceptional 2.2% |
| Immigrants | Nepal | 99.3 /100 | #88 | Exceptional 2.2% |
| British | 99.3 /100 | #89 | Exceptional 2.2% |
| Immigrants | Scotland | 99.2 /100 | #90 | Exceptional 2.2% |
| Immigrants | Sudan | 99.1 /100 | #91 | Exceptional 2.2% |
| Chileans | 99.1 /100 | #92 | Exceptional 2.2% |
| Alsatians | 99.0 /100 | #93 | Exceptional 2.1% |
| Greeks | 98.8 /100 | #94 | Exceptional 2.1% |
| Immigrants | Romania | 98.7 /100 | #95 | Exceptional 2.1% |
| Immigrants | Northern Africa | 98.4 /100 | #96 | Exceptional 2.1% |