Immigrants from China vs Immigrants from Korea Single Mother Households
COMPARE
Immigrants from China
Immigrants from Korea
Single Mother Households
Single Mother Households Comparison
Immigrants from China
Immigrants from Korea
5.1%
SINGLE MOTHER HOUSEHOLDS
99.9/ 100
METRIC RATING
11th/ 347
METRIC RANK
5.3%
SINGLE MOTHER HOUSEHOLDS
99.7/ 100
METRIC RATING
31st/ 347
METRIC RANK
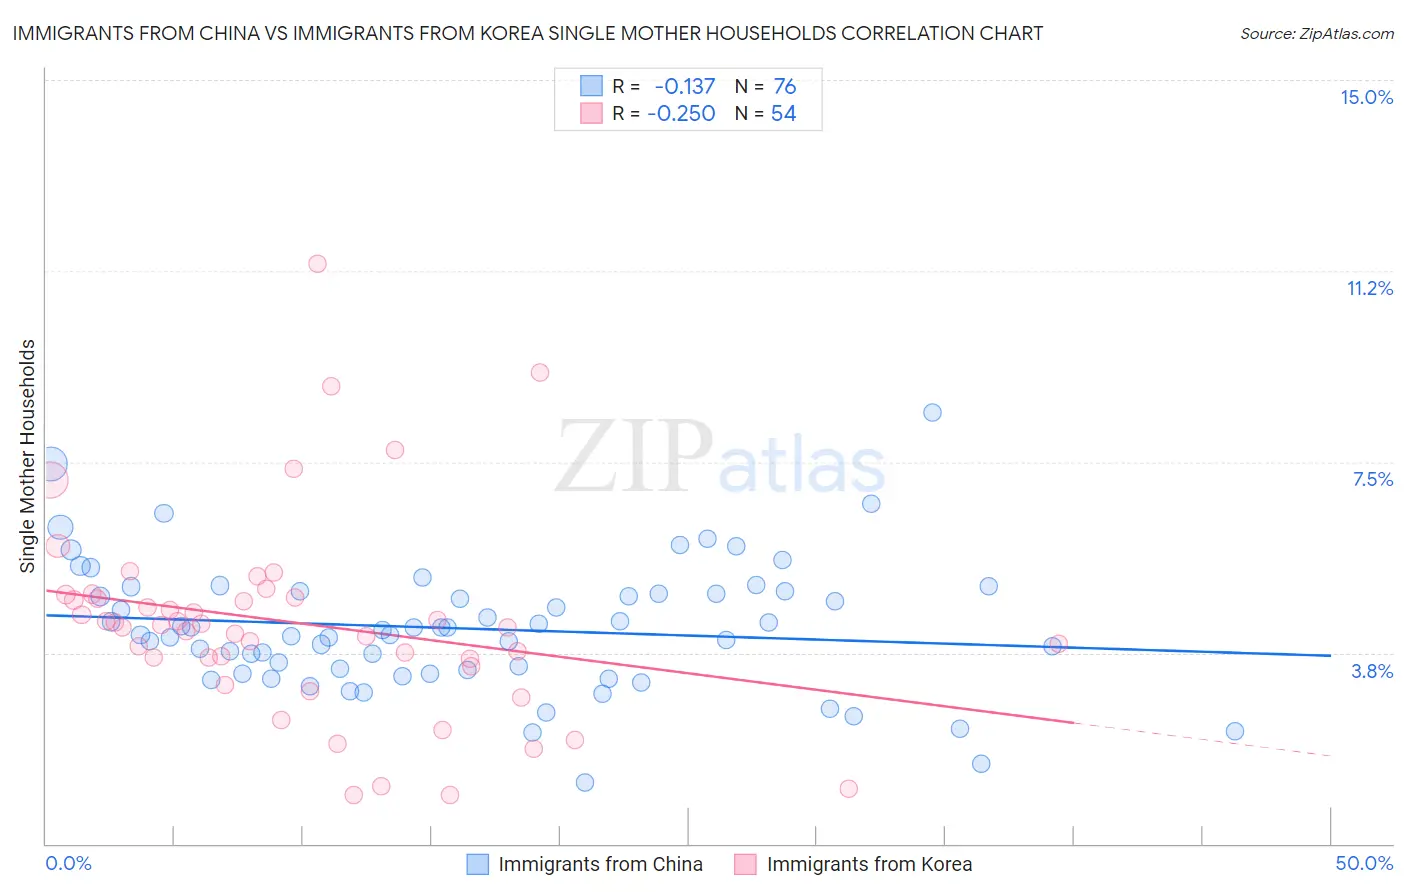
Immigrants from China vs Immigrants from Korea Single Mother Households Correlation Chart
The statistical analysis conducted on geographies consisting of 455,104,054 people shows a poor negative correlation between the proportion of Immigrants from China and percentage of single mother households in the United States with a correlation coefficient (R) of -0.137 and weighted average of 5.1%. Similarly, the statistical analysis conducted on geographies consisting of 414,811,285 people shows a weak negative correlation between the proportion of Immigrants from Korea and percentage of single mother households in the United States with a correlation coefficient (R) of -0.250 and weighted average of 5.3%, a difference of 4.5%.
Single Mother Households Correlation Summary
| Measurement | Immigrants from China | Immigrants from Korea |
| Minimum | 1.2% | 0.95% |
| Maximum | 8.5% | 11.4% |
| Range | 7.3% | 10.4% |
| Mean | 4.2% | 4.3% |
| Median | 4.1% | 4.3% |
| Interquartile 25% (IQ1) | 3.4% | 3.6% |
| Interquartile 75% (IQ3) | 4.9% | 4.8% |
| Interquartile Range (IQR) | 1.6% | 1.2% |
| Standard Deviation (Sample) | 1.3% | 2.0% |
| Standard Deviation (Population) | 1.3% | 2.0% |
Demographics Similar to Immigrants from China and Immigrants from Korea by Single Mother Households
In terms of single mother households, the demographic groups most similar to Immigrants from China are Cypriot (5.1%, a difference of 0.18%), Immigrants from India (5.1%, a difference of 0.30%), Immigrants from Australia (5.1%, a difference of 0.63%), Immigrants from Eastern Asia (5.1%, a difference of 0.72%), and Indian (Asian) (5.1%, a difference of 0.91%). Similarly, the demographic groups most similar to Immigrants from Korea are Burmese (5.3%, a difference of 0.0%), Latvian (5.3%, a difference of 0.070%), Russian (5.3%, a difference of 0.080%), Bhutanese (5.3%, a difference of 0.18%), and Immigrants from Lithuania (5.3%, a difference of 0.69%).
| Demographics | Rating | Rank | Single Mother Households |
| Immigrants | China | 99.9 /100 | #11 | Exceptional 5.1% |
| Cypriots | 99.9 /100 | #12 | Exceptional 5.1% |
| Immigrants | India | 99.9 /100 | #13 | Exceptional 5.1% |
| Immigrants | Australia | 99.9 /100 | #14 | Exceptional 5.1% |
| Immigrants | Eastern Asia | 99.9 /100 | #15 | Exceptional 5.1% |
| Indians (Asian) | 99.9 /100 | #16 | Exceptional 5.1% |
| Soviet Union | 99.9 /100 | #17 | Exceptional 5.1% |
| Immigrants | Armenia | 99.9 /100 | #18 | Exceptional 5.2% |
| Chinese | 99.9 /100 | #19 | Exceptional 5.2% |
| Maltese | 99.9 /100 | #20 | Exceptional 5.2% |
| Eastern Europeans | 99.8 /100 | #21 | Exceptional 5.2% |
| Thais | 99.8 /100 | #22 | Exceptional 5.2% |
| Immigrants | Austria | 99.8 /100 | #23 | Exceptional 5.2% |
| Armenians | 99.8 /100 | #24 | Exceptional 5.2% |
| Immigrants | Japan | 99.8 /100 | #25 | Exceptional 5.2% |
| Immigrants | Lithuania | 99.8 /100 | #26 | Exceptional 5.3% |
| Bhutanese | 99.7 /100 | #27 | Exceptional 5.3% |
| Russians | 99.7 /100 | #28 | Exceptional 5.3% |
| Latvians | 99.7 /100 | #29 | Exceptional 5.3% |
| Burmese | 99.7 /100 | #30 | Exceptional 5.3% |
| Immigrants | Korea | 99.7 /100 | #31 | Exceptional 5.3% |