Immigrants from China vs Immigrants from Indonesia 8th Grade
COMPARE
Immigrants from China
Immigrants from Indonesia
8th Grade
8th Grade Comparison
Immigrants from China
Immigrants from Indonesia
95.0%
8TH GRADE
1.1/ 100
METRIC RATING
249th/ 347
METRIC RANK
95.3%
8TH GRADE
4.4/ 100
METRIC RATING
229th/ 347
METRIC RANK
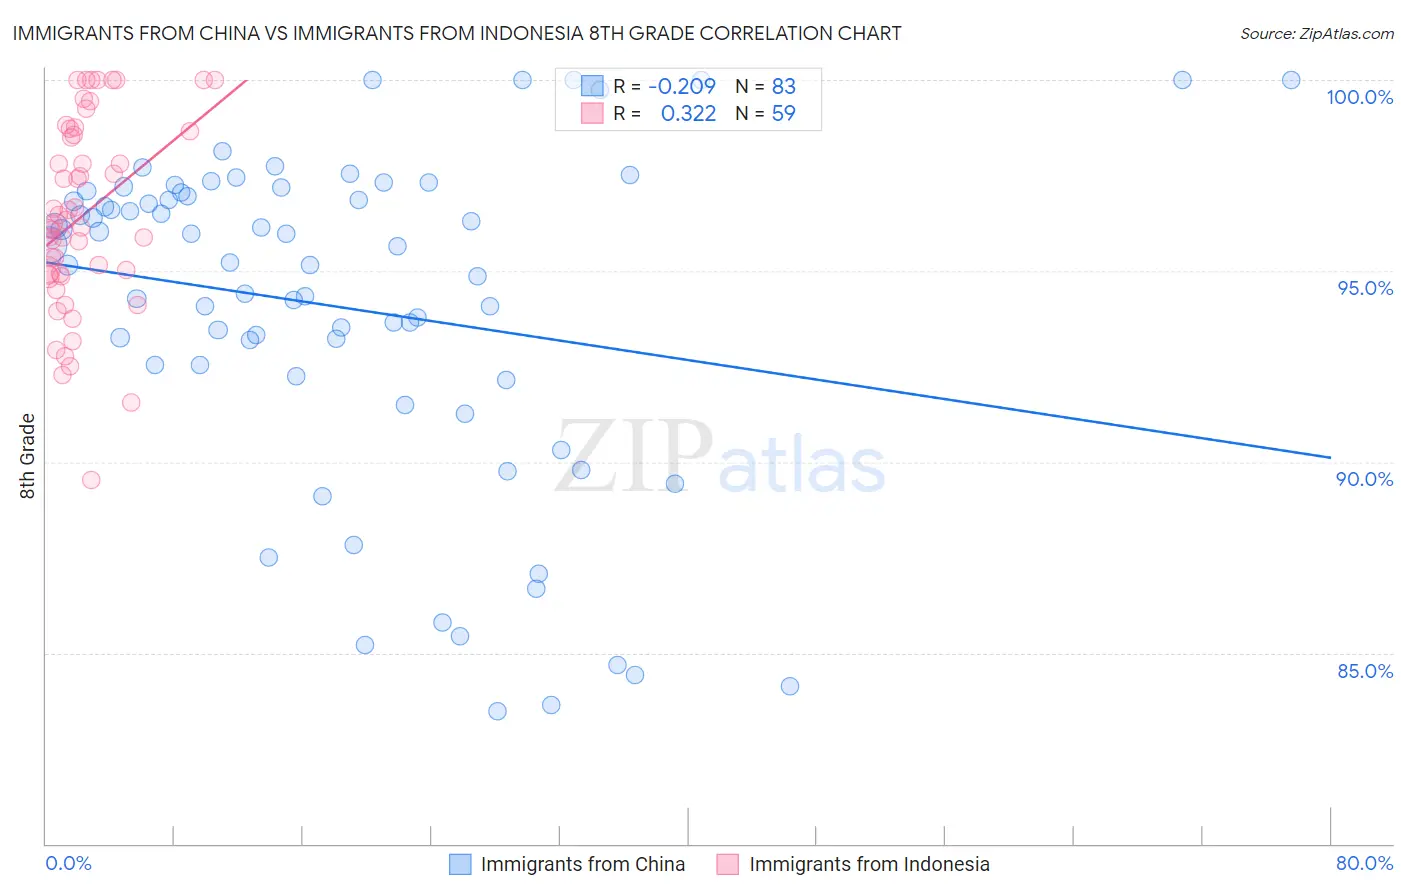
Immigrants from China vs Immigrants from Indonesia 8th Grade Correlation Chart
The statistical analysis conducted on geographies consisting of 457,082,957 people shows a weak negative correlation between the proportion of Immigrants from China and percentage of population with at least 8th grade education in the United States with a correlation coefficient (R) of -0.209 and weighted average of 95.0%. Similarly, the statistical analysis conducted on geographies consisting of 215,671,959 people shows a mild positive correlation between the proportion of Immigrants from Indonesia and percentage of population with at least 8th grade education in the United States with a correlation coefficient (R) of 0.322 and weighted average of 95.3%, a difference of 0.23%.
8th Grade Correlation Summary
| Measurement | Immigrants from China | Immigrants from Indonesia |
| Minimum | 83.5% | 89.5% |
| Maximum | 100.0% | 100.0% |
| Range | 16.5% | 10.5% |
| Mean | 94.0% | 96.5% |
| Median | 95.2% | 96.2% |
| Interquartile 25% (IQ1) | 92.3% | 94.9% |
| Interquartile 75% (IQ3) | 97.0% | 98.7% |
| Interquartile Range (IQR) | 4.8% | 3.8% |
| Standard Deviation (Sample) | 4.4% | 2.5% |
| Standard Deviation (Population) | 4.3% | 2.5% |
Demographics Similar to Immigrants from China and Immigrants from Indonesia by 8th Grade
In terms of 8th grade, the demographic groups most similar to Immigrants from China are Uruguayan (95.1%, a difference of 0.020%), Somali (95.1%, a difference of 0.040%), Immigrants from Senegal (95.1%, a difference of 0.040%), Jamaican (95.1%, a difference of 0.050%), and Paiute (95.1%, a difference of 0.070%). Similarly, the demographic groups most similar to Immigrants from Indonesia are Immigrants from Panama (95.2%, a difference of 0.010%), Asian (95.2%, a difference of 0.040%), Indian (Asian) (95.2%, a difference of 0.050%), Immigrants from Asia (95.2%, a difference of 0.060%), and Costa Rican (95.2%, a difference of 0.060%).
| Demographics | Rating | Rank | 8th Grade |
| Immigrants | Indonesia | 4.4 /100 | #229 | Tragic 95.3% |
| Immigrants | Panama | 4.1 /100 | #230 | Tragic 95.2% |
| Asians | 3.5 /100 | #231 | Tragic 95.2% |
| Indians (Asian) | 3.3 /100 | #232 | Tragic 95.2% |
| Immigrants | Asia | 3.1 /100 | #233 | Tragic 95.2% |
| Costa Ricans | 3.0 /100 | #234 | Tragic 95.2% |
| Nigerians | 2.9 /100 | #235 | Tragic 95.2% |
| Senegalese | 2.7 /100 | #236 | Tragic 95.2% |
| Immigrants | Africa | 2.7 /100 | #237 | Tragic 95.2% |
| Natives/Alaskans | 2.3 /100 | #238 | Tragic 95.2% |
| Immigrants | Sierra Leone | 2.1 /100 | #239 | Tragic 95.1% |
| Ethiopians | 2.0 /100 | #240 | Tragic 95.1% |
| South American Indians | 1.9 /100 | #241 | Tragic 95.1% |
| Tongans | 1.7 /100 | #242 | Tragic 95.1% |
| Paiute | 1.7 /100 | #243 | Tragic 95.1% |
| Immigrants | Middle Africa | 1.7 /100 | #244 | Tragic 95.1% |
| Jamaicans | 1.4 /100 | #245 | Tragic 95.1% |
| Somalis | 1.4 /100 | #246 | Tragic 95.1% |
| Immigrants | Senegal | 1.4 /100 | #247 | Tragic 95.1% |
| Uruguayans | 1.2 /100 | #248 | Tragic 95.1% |
| Immigrants | China | 1.1 /100 | #249 | Tragic 95.0% |