Immigrants from Western Europe vs Serbian 6th Grade
COMPARE
Immigrants from Western Europe
Serbian
6th Grade
6th Grade Comparison
Immigrants from Western Europe
Serbians
97.5%
6TH GRADE
98.8/ 100
METRIC RATING
91st/ 347
METRIC RANK
97.7%
6TH GRADE
99.7/ 100
METRIC RATING
61st/ 347
METRIC RANK
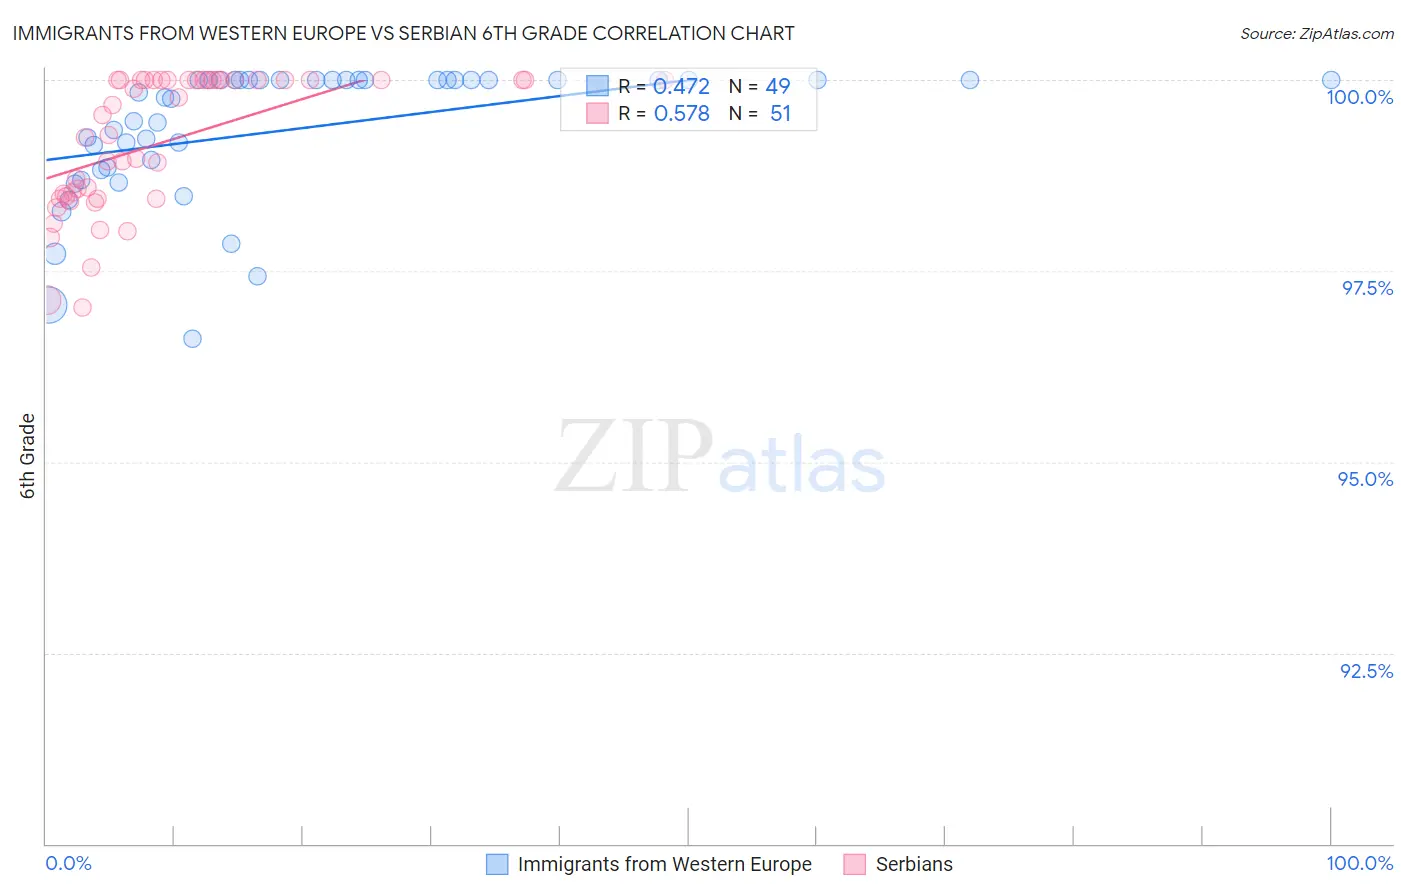
Immigrants from Western Europe vs Serbian 6th Grade Correlation Chart
The statistical analysis conducted on geographies consisting of 494,080,297 people shows a moderate positive correlation between the proportion of Immigrants from Western Europe and percentage of population with at least 6th grade education in the United States with a correlation coefficient (R) of 0.472 and weighted average of 97.5%. Similarly, the statistical analysis conducted on geographies consisting of 267,642,942 people shows a substantial positive correlation between the proportion of Serbians and percentage of population with at least 6th grade education in the United States with a correlation coefficient (R) of 0.578 and weighted average of 97.7%, a difference of 0.18%.
6th Grade Correlation Summary
| Measurement | Immigrants from Western Europe | Serbian |
| Minimum | 96.6% | 97.0% |
| Maximum | 100.0% | 100.0% |
| Range | 3.4% | 3.0% |
| Mean | 99.3% | 99.2% |
| Median | 99.8% | 99.5% |
| Interquartile 25% (IQ1) | 98.8% | 98.4% |
| Interquartile 75% (IQ3) | 100.0% | 100.0% |
| Interquartile Range (IQR) | 1.2% | 1.6% |
| Standard Deviation (Sample) | 0.88% | 0.88% |
| Standard Deviation (Population) | 0.87% | 0.87% |
Similar Demographics by 6th Grade
Demographics Similar to Immigrants from Western Europe by 6th Grade
In terms of 6th grade, the demographic groups most similar to Immigrants from Western Europe are Pueblo (97.5%, a difference of 0.0%), Immigrants from Belgium (97.5%, a difference of 0.010%), Puget Sound Salish (97.5%, a difference of 0.010%), Immigrants from South Africa (97.5%, a difference of 0.010%), and Immigrants from Australia (97.5%, a difference of 0.010%).
| Demographics | Rating | Rank | 6th Grade |
| Shoshone | 99.0 /100 | #84 | Exceptional 97.6% |
| Delaware | 98.9 /100 | #85 | Exceptional 97.6% |
| Immigrants | Belgium | 98.9 /100 | #86 | Exceptional 97.5% |
| Puget Sound Salish | 98.9 /100 | #87 | Exceptional 97.5% |
| Immigrants | South Africa | 98.9 /100 | #88 | Exceptional 97.5% |
| Immigrants | Australia | 98.8 /100 | #89 | Exceptional 97.5% |
| Pueblo | 98.8 /100 | #90 | Exceptional 97.5% |
| Immigrants | Western Europe | 98.8 /100 | #91 | Exceptional 97.5% |
| Romanians | 98.7 /100 | #92 | Exceptional 97.5% |
| Cree | 98.7 /100 | #93 | Exceptional 97.5% |
| Cypriots | 98.7 /100 | #94 | Exceptional 97.5% |
| Immigrants | Ireland | 98.7 /100 | #95 | Exceptional 97.5% |
| Immigrants | Germany | 98.6 /100 | #96 | Exceptional 97.5% |
| Immigrants | Sweden | 98.6 /100 | #97 | Exceptional 97.5% |
| Immigrants | Denmark | 98.5 /100 | #98 | Exceptional 97.5% |
Demographics Similar to Serbians by 6th Grade
In terms of 6th grade, the demographic groups most similar to Serbians are Immigrants from Canada (97.7%, a difference of 0.0%), American (97.7%, a difference of 0.010%), Immigrants from North America (97.7%, a difference of 0.010%), White/Caucasian (97.7%, a difference of 0.020%), and Greek (97.7%, a difference of 0.020%).
| Demographics | Rating | Rank | 6th Grade |
| Creek | 99.8 /100 | #54 | Exceptional 97.7% |
| Aleuts | 99.8 /100 | #55 | Exceptional 97.7% |
| Austrians | 99.8 /100 | #56 | Exceptional 97.7% |
| Whites/Caucasians | 99.8 /100 | #57 | Exceptional 97.7% |
| Greeks | 99.8 /100 | #58 | Exceptional 97.7% |
| Americans | 99.8 /100 | #59 | Exceptional 97.7% |
| Immigrants | Canada | 99.8 /100 | #60 | Exceptional 97.7% |
| Serbians | 99.7 /100 | #61 | Exceptional 97.7% |
| Immigrants | North America | 99.7 /100 | #62 | Exceptional 97.7% |
| Russians | 99.7 /100 | #63 | Exceptional 97.7% |
| Canadians | 99.7 /100 | #64 | Exceptional 97.7% |
| Immigrants | Northern Europe | 99.6 /100 | #65 | Exceptional 97.7% |
| New Zealanders | 99.6 /100 | #66 | Exceptional 97.7% |
| Kiowa | 99.6 /100 | #67 | Exceptional 97.7% |
| Immigrants | Austria | 99.6 /100 | #68 | Exceptional 97.7% |