Immigrants from Chile vs Panamanian 2nd Grade
COMPARE
Immigrants from Chile
Panamanian
2nd Grade
2nd Grade Comparison
Immigrants from Chile
Panamanians
97.7%
2ND GRADE
17.3/ 100
METRIC RATING
206th/ 347
METRIC RANK
97.8%
2ND GRADE
33.5/ 100
METRIC RATING
189th/ 347
METRIC RANK
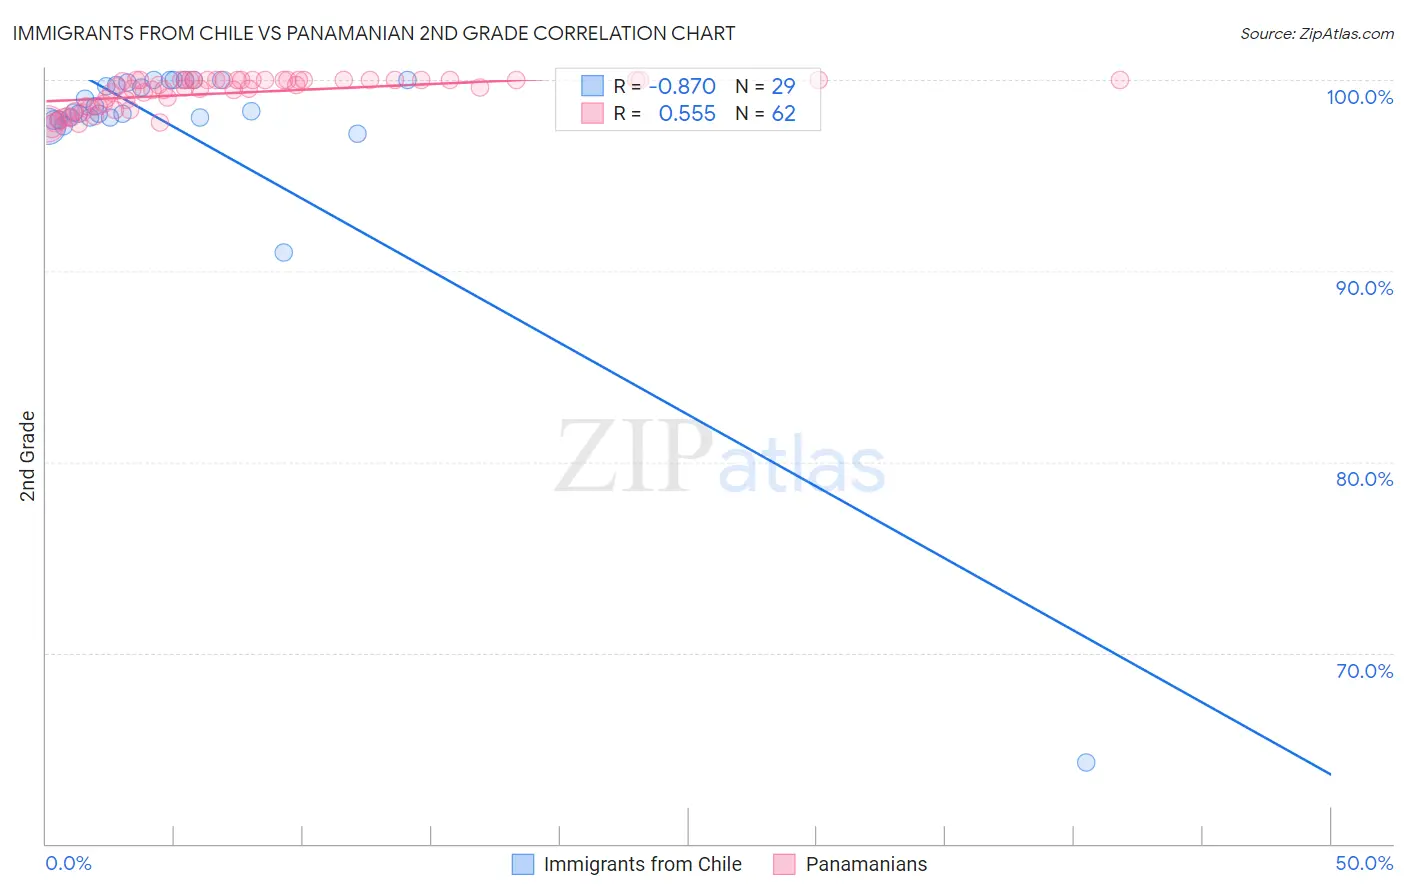
Immigrants from Chile vs Panamanian 2nd Grade Correlation Chart
The statistical analysis conducted on geographies consisting of 218,647,266 people shows a very strong negative correlation between the proportion of Immigrants from Chile and percentage of population with at least 2nd grade education in the United States with a correlation coefficient (R) of -0.870 and weighted average of 97.7%. Similarly, the statistical analysis conducted on geographies consisting of 281,248,945 people shows a substantial positive correlation between the proportion of Panamanians and percentage of population with at least 2nd grade education in the United States with a correlation coefficient (R) of 0.555 and weighted average of 97.8%, a difference of 0.070%.
2nd Grade Correlation Summary
| Measurement | Immigrants from Chile | Panamanian |
| Minimum | 64.3% | 97.6% |
| Maximum | 100.0% | 100.0% |
| Range | 35.7% | 2.4% |
| Mean | 97.4% | 99.3% |
| Median | 98.3% | 99.6% |
| Interquartile 25% (IQ1) | 98.0% | 98.6% |
| Interquartile 75% (IQ3) | 99.9% | 100.0% |
| Interquartile Range (IQR) | 1.9% | 1.4% |
| Standard Deviation (Sample) | 6.6% | 0.82% |
| Standard Deviation (Population) | 6.5% | 0.81% |
Demographics Similar to Immigrants from Chile and Panamanians by 2nd Grade
In terms of 2nd grade, the demographic groups most similar to Immigrants from Chile are Immigrants from Southern Europe (97.8%, a difference of 0.0%), Yuman (97.8%, a difference of 0.010%), Immigrants from Albania (97.8%, a difference of 0.010%), African (97.7%, a difference of 0.010%), and Immigrants from Lebanon (97.8%, a difference of 0.020%). Similarly, the demographic groups most similar to Panamanians are Pakistani (97.8%, a difference of 0.010%), Immigrants from Kazakhstan (97.8%, a difference of 0.010%), Immigrants from Taiwan (97.8%, a difference of 0.010%), Paraguayan (97.8%, a difference of 0.010%), and Black/African American (97.8%, a difference of 0.010%).
| Demographics | Rating | Rank | 2nd Grade |
| Pakistanis | 36.1 /100 | #187 | Fair 97.8% |
| Immigrants | Kazakhstan | 35.6 /100 | #188 | Fair 97.8% |
| Panamanians | 33.5 /100 | #189 | Fair 97.8% |
| Immigrants | Taiwan | 31.8 /100 | #190 | Fair 97.8% |
| Paraguayans | 30.8 /100 | #191 | Fair 97.8% |
| Blacks/African Americans | 29.9 /100 | #192 | Fair 97.8% |
| Hawaiians | 28.5 /100 | #193 | Fair 97.8% |
| Paiute | 27.0 /100 | #194 | Fair 97.8% |
| Mongolians | 26.7 /100 | #195 | Fair 97.8% |
| Immigrants | Kenya | 26.4 /100 | #196 | Fair 97.8% |
| Immigrants | Uganda | 26.3 /100 | #197 | Fair 97.8% |
| Guamanians/Chamorros | 25.7 /100 | #198 | Fair 97.8% |
| Immigrants | Egypt | 24.4 /100 | #199 | Fair 97.8% |
| Immigrants | Lebanon | 20.9 /100 | #200 | Fair 97.8% |
| Tohono O'odham | 20.9 /100 | #201 | Fair 97.8% |
| Immigrants | Ukraine | 20.5 /100 | #202 | Fair 97.8% |
| Yuman | 20.0 /100 | #203 | Fair 97.8% |
| Immigrants | Albania | 18.4 /100 | #204 | Poor 97.8% |
| Immigrants | Southern Europe | 18.1 /100 | #205 | Poor 97.8% |
| Immigrants | Chile | 17.3 /100 | #206 | Poor 97.7% |
| Africans | 15.6 /100 | #207 | Poor 97.7% |