Immigrants from Vietnam vs Panamanian 2nd Grade
COMPARE
Immigrants from Vietnam
Panamanian
2nd Grade
2nd Grade Comparison
Immigrants from Vietnam
Panamanians
96.5%
2ND GRADE
0.0/ 100
METRIC RATING
327th/ 347
METRIC RANK
97.8%
2ND GRADE
33.5/ 100
METRIC RATING
189th/ 347
METRIC RANK
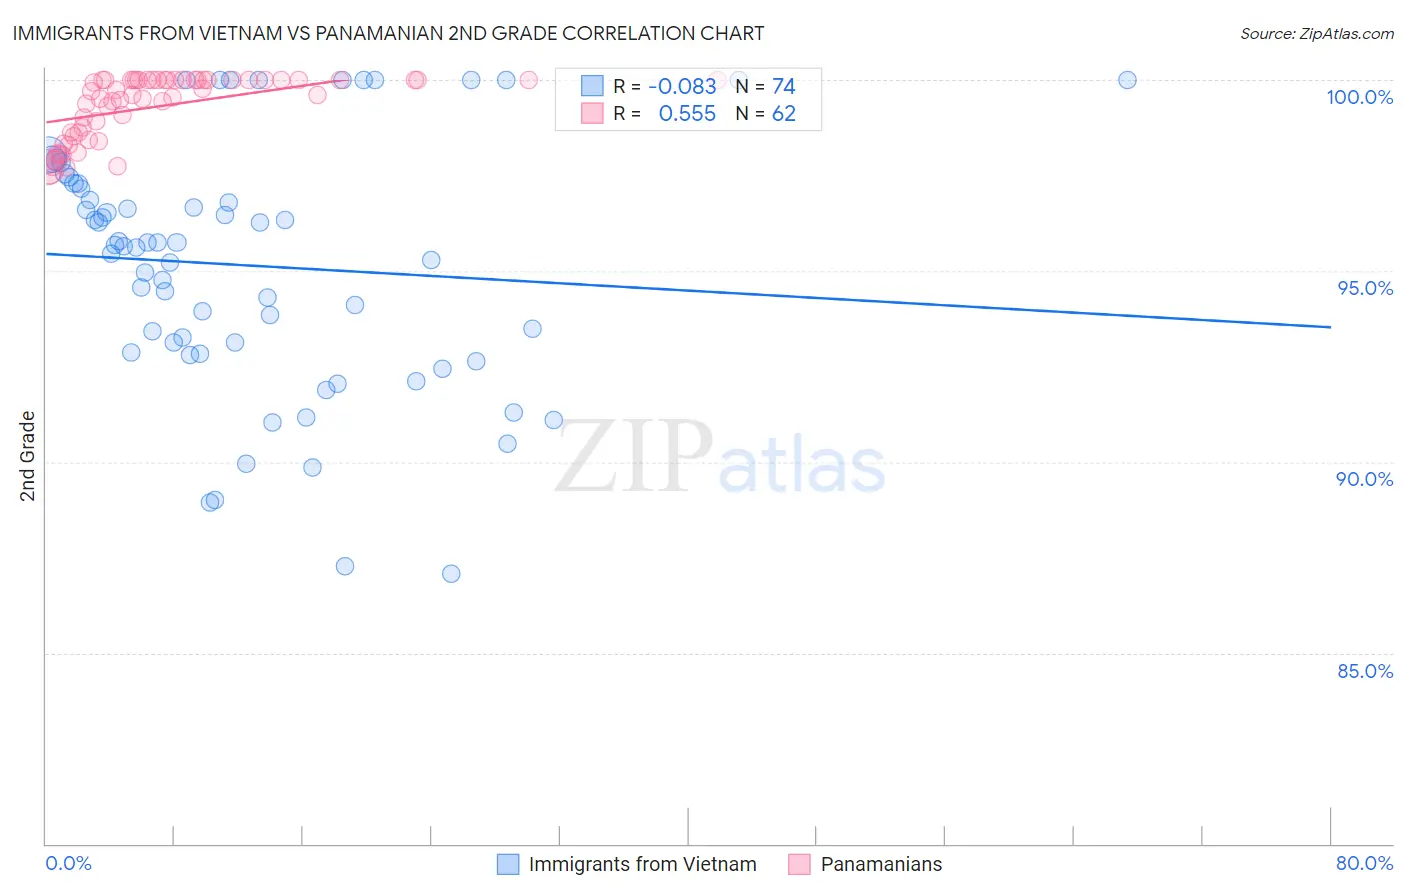
Immigrants from Vietnam vs Panamanian 2nd Grade Correlation Chart
The statistical analysis conducted on geographies consisting of 404,844,130 people shows a slight negative correlation between the proportion of Immigrants from Vietnam and percentage of population with at least 2nd grade education in the United States with a correlation coefficient (R) of -0.083 and weighted average of 96.5%. Similarly, the statistical analysis conducted on geographies consisting of 281,248,945 people shows a substantial positive correlation between the proportion of Panamanians and percentage of population with at least 2nd grade education in the United States with a correlation coefficient (R) of 0.555 and weighted average of 97.8%, a difference of 1.3%.
2nd Grade Correlation Summary
| Measurement | Immigrants from Vietnam | Panamanian |
| Minimum | 87.1% | 97.6% |
| Maximum | 100.0% | 100.0% |
| Range | 12.9% | 2.4% |
| Mean | 95.1% | 99.3% |
| Median | 95.7% | 99.6% |
| Interquartile 25% (IQ1) | 92.9% | 98.6% |
| Interquartile 75% (IQ3) | 97.3% | 100.0% |
| Interquartile Range (IQR) | 4.4% | 1.4% |
| Standard Deviation (Sample) | 3.2% | 0.82% |
| Standard Deviation (Population) | 3.2% | 0.81% |
Similar Demographics by 2nd Grade
Demographics Similar to Immigrants from Vietnam by 2nd Grade
In terms of 2nd grade, the demographic groups most similar to Immigrants from Vietnam are Mexican (96.5%, a difference of 0.0%), Japanese (96.5%, a difference of 0.010%), Immigrants from Latin America (96.5%, a difference of 0.010%), Immigrants from Armenia (96.5%, a difference of 0.050%), and Bangladeshi (96.5%, a difference of 0.060%).
| Demographics | Rating | Rank | 2nd Grade |
| Immigrants | Guyana | 0.0 /100 | #320 | Tragic 96.7% |
| Immigrants | Burma/Myanmar | 0.0 /100 | #321 | Tragic 96.7% |
| Immigrants | Bangladesh | 0.0 /100 | #322 | Tragic 96.7% |
| Vietnamese | 0.0 /100 | #323 | Tragic 96.7% |
| Mexican American Indians | 0.0 /100 | #324 | Tragic 96.7% |
| Dominicans | 0.0 /100 | #325 | Tragic 96.6% |
| Immigrants | Honduras | 0.0 /100 | #326 | Tragic 96.6% |
| Immigrants | Vietnam | 0.0 /100 | #327 | Tragic 96.5% |
| Mexicans | 0.0 /100 | #328 | Tragic 96.5% |
| Japanese | 0.0 /100 | #329 | Tragic 96.5% |
| Immigrants | Latin America | 0.0 /100 | #330 | Tragic 96.5% |
| Immigrants | Armenia | 0.0 /100 | #331 | Tragic 96.5% |
| Bangladeshis | 0.0 /100 | #332 | Tragic 96.5% |
| Immigrants | Dominican Republic | 0.0 /100 | #333 | Tragic 96.4% |
| Central Americans | 0.0 /100 | #334 | Tragic 96.4% |
Demographics Similar to Panamanians by 2nd Grade
In terms of 2nd grade, the demographic groups most similar to Panamanians are Arab (97.8%, a difference of 0.010%), Pakistani (97.8%, a difference of 0.010%), Immigrants from Kazakhstan (97.8%, a difference of 0.010%), Immigrants from Taiwan (97.8%, a difference of 0.010%), and Paraguayan (97.8%, a difference of 0.010%).
| Demographics | Rating | Rank | 2nd Grade |
| Portuguese | 42.4 /100 | #182 | Average 97.8% |
| Immigrants | Poland | 42.2 /100 | #183 | Average 97.8% |
| Immigrants | Belarus | 41.5 /100 | #184 | Average 97.8% |
| Immigrants | Argentina | 40.6 /100 | #185 | Average 97.8% |
| Arabs | 36.9 /100 | #186 | Fair 97.8% |
| Pakistanis | 36.1 /100 | #187 | Fair 97.8% |
| Immigrants | Kazakhstan | 35.6 /100 | #188 | Fair 97.8% |
| Panamanians | 33.5 /100 | #189 | Fair 97.8% |
| Immigrants | Taiwan | 31.8 /100 | #190 | Fair 97.8% |
| Paraguayans | 30.8 /100 | #191 | Fair 97.8% |
| Blacks/African Americans | 29.9 /100 | #192 | Fair 97.8% |
| Hawaiians | 28.5 /100 | #193 | Fair 97.8% |
| Paiute | 27.0 /100 | #194 | Fair 97.8% |
| Mongolians | 26.7 /100 | #195 | Fair 97.8% |
| Immigrants | Kenya | 26.4 /100 | #196 | Fair 97.8% |