Immigrants from Chile vs Panamanian 10th Grade
COMPARE
Immigrants from Chile
Panamanian
10th Grade
10th Grade Comparison
Immigrants from Chile
Panamanians
93.4%
10TH GRADE
18.8/ 100
METRIC RATING
209th/ 347
METRIC RANK
93.5%
10TH GRADE
28.0/ 100
METRIC RATING
193rd/ 347
METRIC RANK
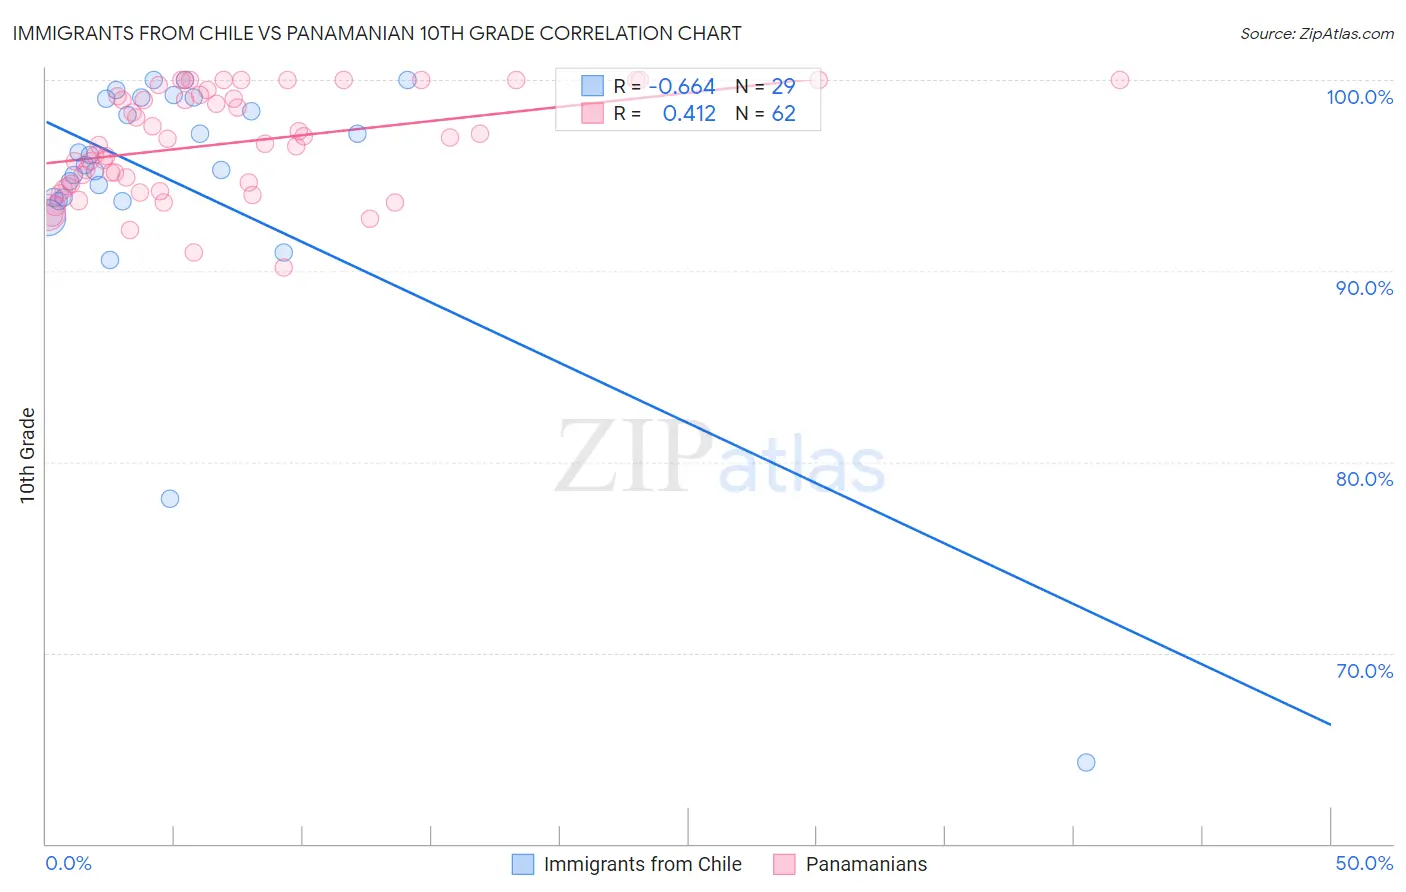
Immigrants from Chile vs Panamanian 10th Grade Correlation Chart
The statistical analysis conducted on geographies consisting of 218,647,266 people shows a significant negative correlation between the proportion of Immigrants from Chile and percentage of population with at least 10th grade education in the United States with a correlation coefficient (R) of -0.664 and weighted average of 93.4%. Similarly, the statistical analysis conducted on geographies consisting of 281,248,945 people shows a moderate positive correlation between the proportion of Panamanians and percentage of population with at least 10th grade education in the United States with a correlation coefficient (R) of 0.412 and weighted average of 93.5%, a difference of 0.12%.
10th Grade Correlation Summary
| Measurement | Immigrants from Chile | Panamanian |
| Minimum | 64.3% | 90.1% |
| Maximum | 100.0% | 100.0% |
| Range | 35.7% | 9.9% |
| Mean | 94.5% | 96.7% |
| Median | 95.6% | 96.8% |
| Interquartile 25% (IQ1) | 93.8% | 94.5% |
| Interquartile 75% (IQ3) | 99.0% | 99.2% |
| Interquartile Range (IQR) | 5.3% | 4.8% |
| Standard Deviation (Sample) | 7.2% | 2.7% |
| Standard Deviation (Population) | 7.1% | 2.7% |
Demographics Similar to Immigrants from Chile and Panamanians by 10th Grade
In terms of 10th grade, the demographic groups most similar to Immigrants from Chile are Samoan (93.4%, a difference of 0.010%), Immigrants from Syria (93.4%, a difference of 0.010%), Immigrants from Western Asia (93.4%, a difference of 0.020%), Ute (93.4%, a difference of 0.020%), and Immigrants from Indonesia (93.4%, a difference of 0.020%). Similarly, the demographic groups most similar to Panamanians are Immigrants from Malaysia (93.5%, a difference of 0.0%), Immigrants from Morocco (93.5%, a difference of 0.010%), Cheyenne (93.5%, a difference of 0.010%), Yup'ik (93.6%, a difference of 0.030%), and Moroccan (93.5%, a difference of 0.030%).
| Demographics | Rating | Rank | 10th Grade |
| Yup'ik | 31.1 /100 | #191 | Fair 93.6% |
| Immigrants | Malaysia | 28.0 /100 | #192 | Fair 93.5% |
| Panamanians | 28.0 /100 | #193 | Fair 93.5% |
| Immigrants | Morocco | 26.9 /100 | #194 | Fair 93.5% |
| Cheyenne | 26.8 /100 | #195 | Fair 93.5% |
| Moroccans | 25.3 /100 | #196 | Fair 93.5% |
| Pueblo | 23.9 /100 | #197 | Fair 93.5% |
| Immigrants | Micronesia | 23.2 /100 | #198 | Fair 93.5% |
| Asians | 23.0 /100 | #199 | Fair 93.5% |
| Hopi | 22.2 /100 | #200 | Fair 93.5% |
| Hawaiians | 21.8 /100 | #201 | Fair 93.5% |
| Immigrants | Uganda | 20.9 /100 | #202 | Fair 93.5% |
| Immigrants | Western Asia | 20.6 /100 | #203 | Fair 93.4% |
| Ute | 20.3 /100 | #204 | Fair 93.4% |
| Immigrants | Indonesia | 20.2 /100 | #205 | Fair 93.4% |
| Immigrants | Sudan | 20.0 /100 | #206 | Fair 93.4% |
| Samoans | 19.5 /100 | #207 | Poor 93.4% |
| Immigrants | Syria | 19.4 /100 | #208 | Poor 93.4% |
| Immigrants | Chile | 18.8 /100 | #209 | Poor 93.4% |
| Indians (Asian) | 17.6 /100 | #210 | Poor 93.4% |
| Cajuns | 16.9 /100 | #211 | Poor 93.4% |