Soviet Union vs Panamanian 2nd Grade
COMPARE
Soviet Union
Panamanian
2nd Grade
2nd Grade Comparison
Soviet Union
Panamanians
97.9%
2ND GRADE
70.7/ 100
METRIC RATING
151st/ 347
METRIC RANK
97.8%
2ND GRADE
33.5/ 100
METRIC RATING
189th/ 347
METRIC RANK
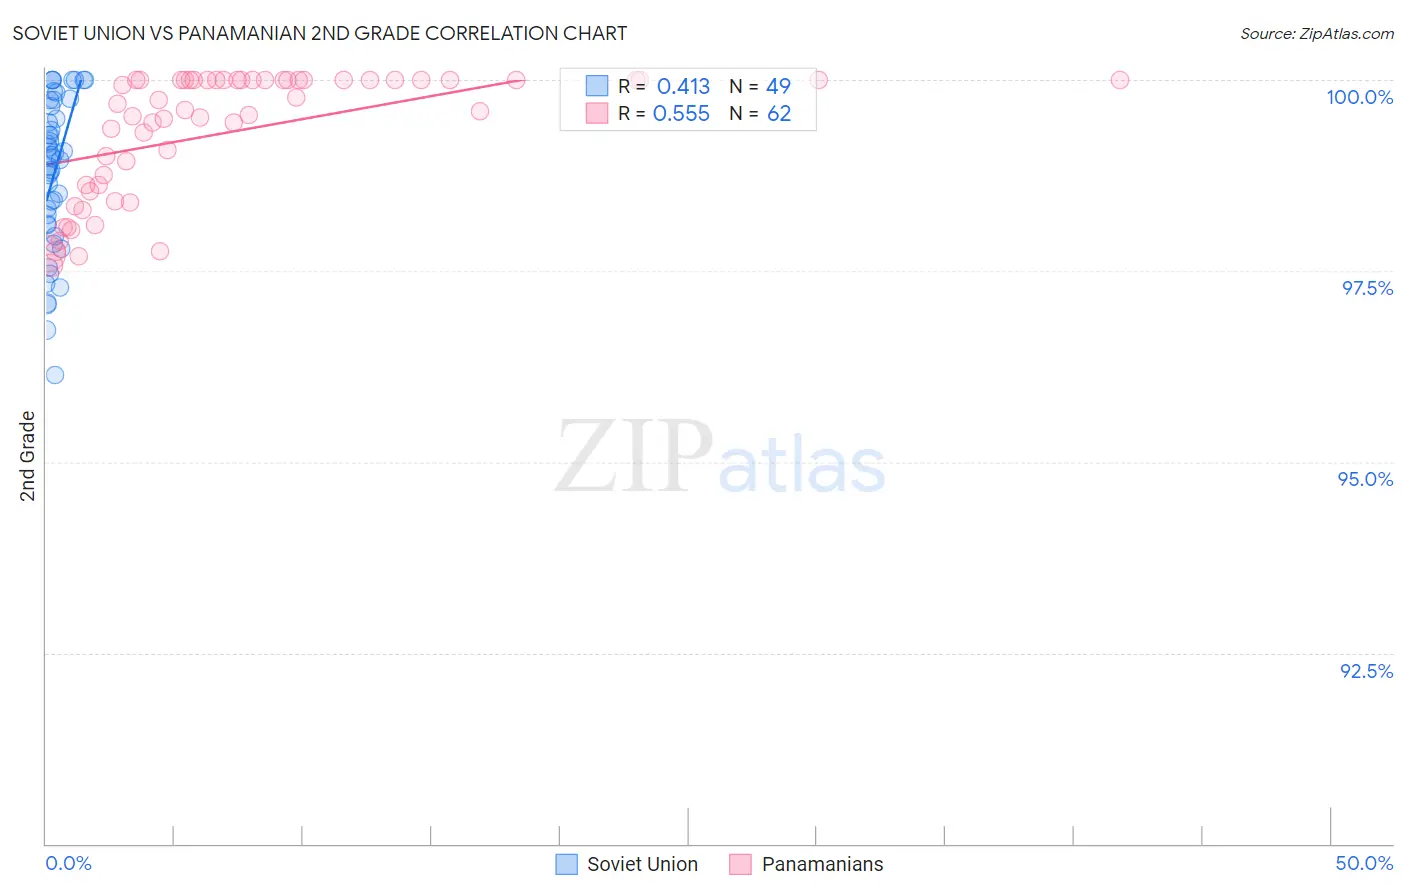
Soviet Union vs Panamanian 2nd Grade Correlation Chart
The statistical analysis conducted on geographies consisting of 43,454,395 people shows a moderate positive correlation between the proportion of Soviet Union and percentage of population with at least 2nd grade education in the United States with a correlation coefficient (R) of 0.413 and weighted average of 97.9%. Similarly, the statistical analysis conducted on geographies consisting of 281,248,945 people shows a substantial positive correlation between the proportion of Panamanians and percentage of population with at least 2nd grade education in the United States with a correlation coefficient (R) of 0.555 and weighted average of 97.8%, a difference of 0.12%.
2nd Grade Correlation Summary
| Measurement | Soviet Union | Panamanian |
| Minimum | 96.1% | 97.6% |
| Maximum | 100.0% | 100.0% |
| Range | 3.9% | 2.4% |
| Mean | 98.8% | 99.3% |
| Median | 99.0% | 99.6% |
| Interquartile 25% (IQ1) | 98.1% | 98.6% |
| Interquartile 75% (IQ3) | 99.7% | 100.0% |
| Interquartile Range (IQR) | 1.6% | 1.4% |
| Standard Deviation (Sample) | 1.00% | 0.82% |
| Standard Deviation (Population) | 0.99% | 0.81% |
Similar Demographics by 2nd Grade
Demographics Similar to Soviet Union by 2nd Grade
In terms of 2nd grade, the demographic groups most similar to Soviet Union are Apache (97.9%, a difference of 0.010%), Immigrants from Moldova (97.9%, a difference of 0.010%), Immigrants from North Macedonia (97.9%, a difference of 0.010%), Immigrants from South Central Asia (97.9%, a difference of 0.010%), and Marshallese (97.9%, a difference of 0.010%).
| Demographics | Rating | Rank | 2nd Grade |
| Hmong | 80.0 /100 | #144 | Good 98.0% |
| Filipinos | 79.2 /100 | #145 | Good 98.0% |
| Immigrants | Israel | 78.0 /100 | #146 | Good 98.0% |
| Immigrants | Greece | 76.8 /100 | #147 | Good 98.0% |
| Jordanians | 74.5 /100 | #148 | Good 98.0% |
| Apache | 74.0 /100 | #149 | Good 97.9% |
| Immigrants | Moldova | 72.9 /100 | #150 | Good 97.9% |
| Soviet Union | 70.7 /100 | #151 | Good 97.9% |
| Immigrants | North Macedonia | 68.5 /100 | #152 | Good 97.9% |
| Immigrants | South Central Asia | 68.3 /100 | #153 | Good 97.9% |
| Marshallese | 67.7 /100 | #154 | Good 97.9% |
| French American Indians | 64.3 /100 | #155 | Good 97.9% |
| Dutch West Indians | 63.8 /100 | #156 | Good 97.9% |
| Venezuelans | 63.3 /100 | #157 | Good 97.9% |
| Immigrants | Iran | 62.8 /100 | #158 | Good 97.9% |
Demographics Similar to Panamanians by 2nd Grade
In terms of 2nd grade, the demographic groups most similar to Panamanians are Arab (97.8%, a difference of 0.010%), Pakistani (97.8%, a difference of 0.010%), Immigrants from Kazakhstan (97.8%, a difference of 0.010%), Immigrants from Taiwan (97.8%, a difference of 0.010%), and Paraguayan (97.8%, a difference of 0.010%).
| Demographics | Rating | Rank | 2nd Grade |
| Portuguese | 42.4 /100 | #182 | Average 97.8% |
| Immigrants | Poland | 42.2 /100 | #183 | Average 97.8% |
| Immigrants | Belarus | 41.5 /100 | #184 | Average 97.8% |
| Immigrants | Argentina | 40.6 /100 | #185 | Average 97.8% |
| Arabs | 36.9 /100 | #186 | Fair 97.8% |
| Pakistanis | 36.1 /100 | #187 | Fair 97.8% |
| Immigrants | Kazakhstan | 35.6 /100 | #188 | Fair 97.8% |
| Panamanians | 33.5 /100 | #189 | Fair 97.8% |
| Immigrants | Taiwan | 31.8 /100 | #190 | Fair 97.8% |
| Paraguayans | 30.8 /100 | #191 | Fair 97.8% |
| Blacks/African Americans | 29.9 /100 | #192 | Fair 97.8% |
| Hawaiians | 28.5 /100 | #193 | Fair 97.8% |
| Paiute | 27.0 /100 | #194 | Fair 97.8% |
| Mongolians | 26.7 /100 | #195 | Fair 97.8% |
| Immigrants | Kenya | 26.4 /100 | #196 | Fair 97.8% |