Immigrants from Central America vs Peruvian Professional Degree
COMPARE
Immigrants from Central America
Peruvian
Professional Degree
Professional Degree Comparison
Immigrants from Central America
Peruvians
2.9%
PROFESSIONAL DEGREE
0.0/ 100
METRIC RATING
339th/ 347
METRIC RANK
4.5%
PROFESSIONAL DEGREE
65.2/ 100
METRIC RATING
162nd/ 347
METRIC RANK
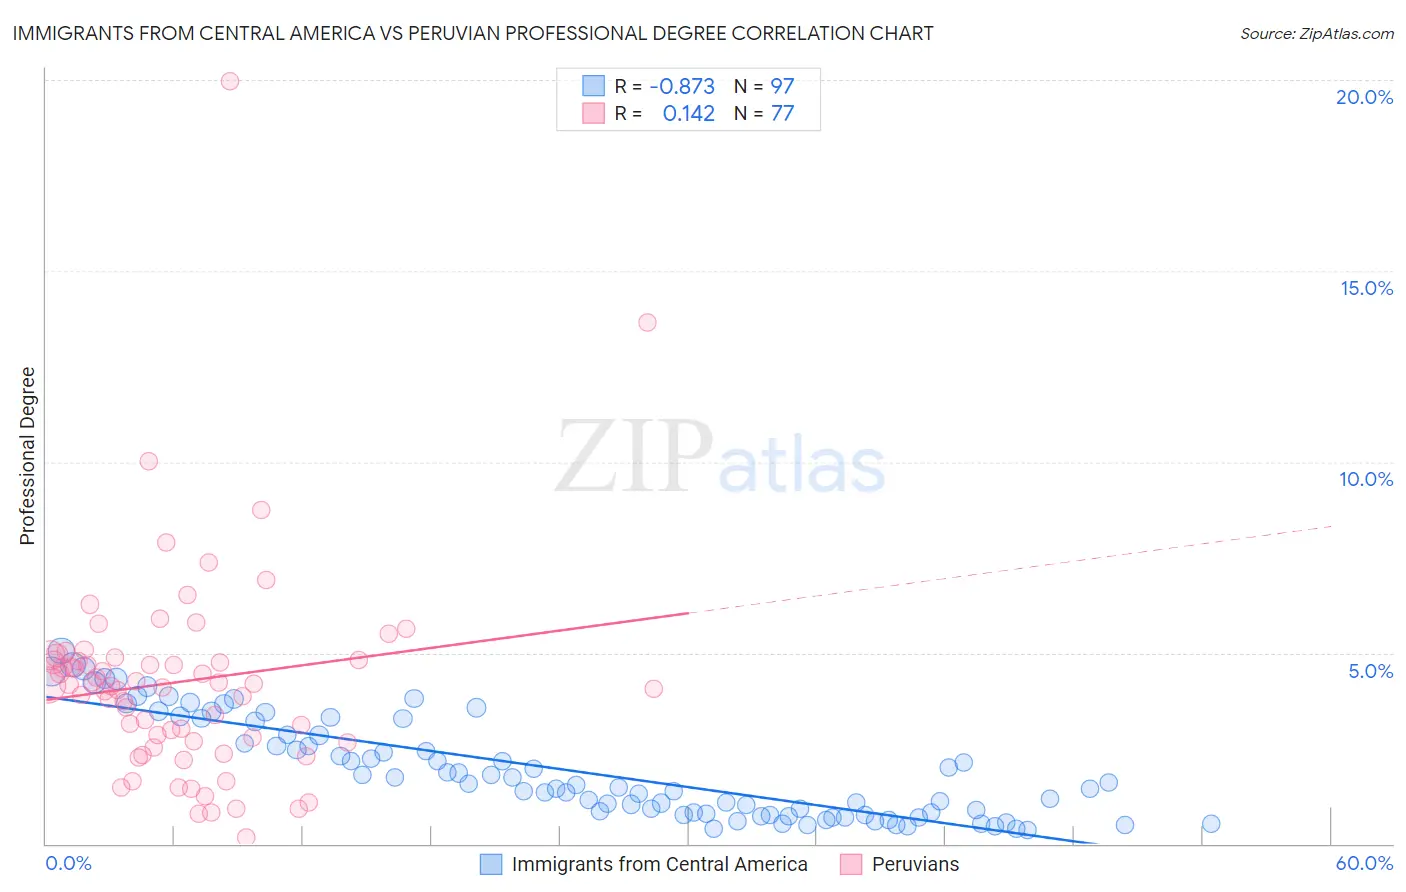
Immigrants from Central America vs Peruvian Professional Degree Correlation Chart
The statistical analysis conducted on geographies consisting of 530,794,106 people shows a very strong negative correlation between the proportion of Immigrants from Central America and percentage of population with at least professional degree education in the United States with a correlation coefficient (R) of -0.873 and weighted average of 2.9%. Similarly, the statistical analysis conducted on geographies consisting of 362,706,840 people shows a poor positive correlation between the proportion of Peruvians and percentage of population with at least professional degree education in the United States with a correlation coefficient (R) of 0.142 and weighted average of 4.5%, a difference of 57.1%.
Professional Degree Correlation Summary
| Measurement | Immigrants from Central America | Peruvian |
| Minimum | 0.36% | 0.17% |
| Maximum | 5.1% | 20.0% |
| Range | 4.7% | 19.8% |
| Mean | 1.9% | 4.2% |
| Median | 1.5% | 4.1% |
| Interquartile 25% (IQ1) | 0.78% | 2.7% |
| Interquartile 75% (IQ3) | 3.0% | 4.8% |
| Interquartile Range (IQR) | 2.3% | 2.2% |
| Standard Deviation (Sample) | 1.3% | 2.8% |
| Standard Deviation (Population) | 1.3% | 2.8% |
Similar Demographics by Professional Degree
Demographics Similar to Immigrants from Central America by Professional Degree
In terms of professional degree, the demographic groups most similar to Immigrants from Central America are Yup'ik (2.9%, a difference of 0.050%), Navajo (2.9%, a difference of 0.12%), Arapaho (2.9%, a difference of 0.19%), Tohono O'odham (2.8%, a difference of 0.83%), and Immigrants from the Azores (2.8%, a difference of 1.5%).
| Demographics | Rating | Rank | Professional Degree |
| Yakama | 0.0 /100 | #332 | Tragic 3.1% |
| Puget Sound Salish | 0.0 /100 | #333 | Tragic 3.1% |
| Pennsylvania Germans | 0.0 /100 | #334 | Tragic 3.0% |
| Natives/Alaskans | 0.0 /100 | #335 | Tragic 3.0% |
| Fijians | 0.0 /100 | #336 | Tragic 2.9% |
| Arapaho | 0.0 /100 | #337 | Tragic 2.9% |
| Navajo | 0.0 /100 | #338 | Tragic 2.9% |
| Immigrants | Central America | 0.0 /100 | #339 | Tragic 2.9% |
| Yup'ik | 0.0 /100 | #340 | Tragic 2.9% |
| Tohono O'odham | 0.0 /100 | #341 | Tragic 2.8% |
| Immigrants | Azores | 0.0 /100 | #342 | Tragic 2.8% |
| Mexicans | 0.0 /100 | #343 | Tragic 2.7% |
| Spanish American Indians | 0.0 /100 | #344 | Tragic 2.7% |
| Immigrants | Mexico | 0.0 /100 | #345 | Tragic 2.6% |
| Lumbee | 0.0 /100 | #346 | Tragic 2.5% |
Demographics Similar to Peruvians by Professional Degree
In terms of professional degree, the demographic groups most similar to Peruvians are Sierra Leonean (4.5%, a difference of 0.14%), Assyrian/Chaldean/Syriac (4.5%, a difference of 0.34%), Immigrants from Senegal (4.5%, a difference of 0.44%), Vietnamese (4.5%, a difference of 0.50%), and Immigrants from Armenia (4.5%, a difference of 0.58%).
| Demographics | Rating | Rank | Professional Degree |
| Slavs | 70.8 /100 | #155 | Good 4.5% |
| Swedes | 69.9 /100 | #156 | Good 4.5% |
| Iraqis | 69.8 /100 | #157 | Good 4.5% |
| Immigrants | Armenia | 68.8 /100 | #158 | Good 4.5% |
| Vietnamese | 68.4 /100 | #159 | Good 4.5% |
| Immigrants | Senegal | 68.0 /100 | #160 | Good 4.5% |
| Assyrians/Chaldeans/Syriacs | 67.4 /100 | #161 | Good 4.5% |
| Peruvians | 65.2 /100 | #162 | Good 4.5% |
| Sierra Leoneans | 64.3 /100 | #163 | Good 4.5% |
| Swiss | 61.0 /100 | #164 | Good 4.5% |
| Costa Ricans | 59.9 /100 | #165 | Average 4.5% |
| Immigrants | Colombia | 59.4 /100 | #166 | Average 4.5% |
| Immigrants | Afghanistan | 59.2 /100 | #167 | Average 4.5% |
| Immigrants | Sierra Leone | 58.7 /100 | #168 | Average 4.5% |
| Chinese | 58.6 /100 | #169 | Average 4.5% |