Iraqi vs Peruvian Professional Degree
COMPARE
Iraqi
Peruvian
Professional Degree
Professional Degree Comparison
Iraqis
Peruvians
4.5%
PROFESSIONAL DEGREE
69.8/ 100
METRIC RATING
157th/ 347
METRIC RANK
4.5%
PROFESSIONAL DEGREE
65.2/ 100
METRIC RATING
162nd/ 347
METRIC RANK
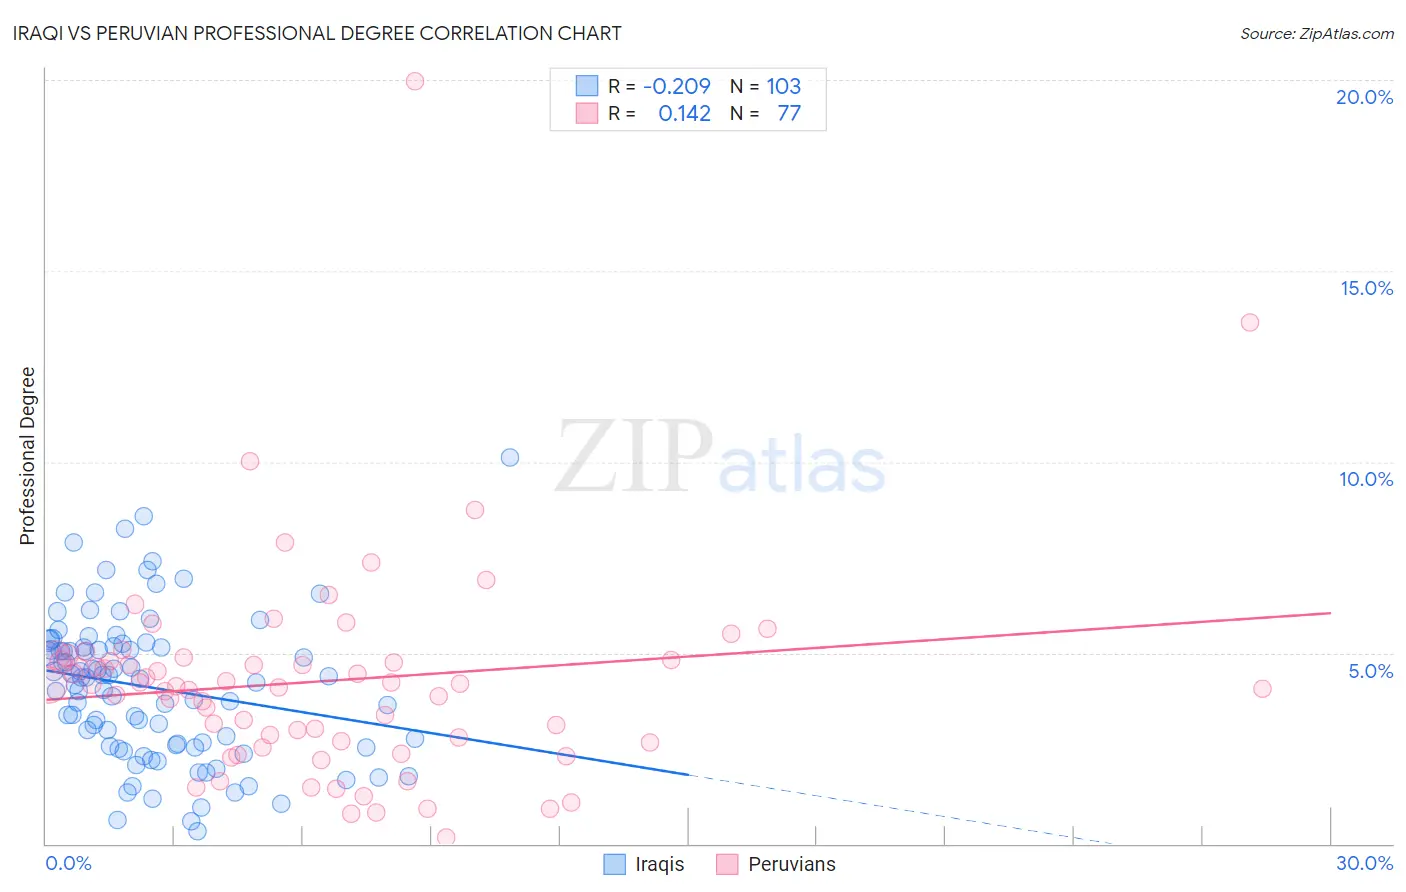
Iraqi vs Peruvian Professional Degree Correlation Chart
The statistical analysis conducted on geographies consisting of 170,610,184 people shows a weak negative correlation between the proportion of Iraqis and percentage of population with at least professional degree education in the United States with a correlation coefficient (R) of -0.209 and weighted average of 4.5%. Similarly, the statistical analysis conducted on geographies consisting of 362,706,840 people shows a poor positive correlation between the proportion of Peruvians and percentage of population with at least professional degree education in the United States with a correlation coefficient (R) of 0.142 and weighted average of 4.5%, a difference of 0.75%.
Professional Degree Correlation Summary
| Measurement | Iraqi | Peruvian |
| Minimum | 0.32% | 0.17% |
| Maximum | 10.1% | 20.0% |
| Range | 9.8% | 19.8% |
| Mean | 4.1% | 4.2% |
| Median | 4.3% | 4.1% |
| Interquartile 25% (IQ1) | 2.6% | 2.7% |
| Interquartile 75% (IQ3) | 5.2% | 4.8% |
| Interquartile Range (IQR) | 2.6% | 2.2% |
| Standard Deviation (Sample) | 1.9% | 2.8% |
| Standard Deviation (Population) | 1.9% | 2.8% |
Demographics Similar to Iraqis and Peruvians by Professional Degree
In terms of professional degree, the demographic groups most similar to Iraqis are Swedish (4.5%, a difference of 0.010%), Slavic (4.5%, a difference of 0.16%), Immigrants from Armenia (4.5%, a difference of 0.17%), Vietnamese (4.5%, a difference of 0.24%), and Immigrants from Senegal (4.5%, a difference of 0.30%). Similarly, the demographic groups most similar to Peruvians are Sierra Leonean (4.5%, a difference of 0.14%), Assyrian/Chaldean/Syriac (4.5%, a difference of 0.34%), Immigrants from Senegal (4.5%, a difference of 0.44%), Vietnamese (4.5%, a difference of 0.50%), and Immigrants from Armenia (4.5%, a difference of 0.58%).
| Demographics | Rating | Rank | Professional Degree |
| Senegalese | 75.3 /100 | #149 | Good 4.6% |
| Immigrants | Oceania | 73.4 /100 | #150 | Good 4.6% |
| Poles | 72.6 /100 | #151 | Good 4.6% |
| Immigrants | Africa | 72.5 /100 | #152 | Good 4.6% |
| Immigrants | Uruguay | 72.5 /100 | #153 | Good 4.6% |
| Scottish | 71.8 /100 | #154 | Good 4.6% |
| Slavs | 70.8 /100 | #155 | Good 4.5% |
| Swedes | 69.9 /100 | #156 | Good 4.5% |
| Iraqis | 69.8 /100 | #157 | Good 4.5% |
| Immigrants | Armenia | 68.8 /100 | #158 | Good 4.5% |
| Vietnamese | 68.4 /100 | #159 | Good 4.5% |
| Immigrants | Senegal | 68.0 /100 | #160 | Good 4.5% |
| Assyrians/Chaldeans/Syriacs | 67.4 /100 | #161 | Good 4.5% |
| Peruvians | 65.2 /100 | #162 | Good 4.5% |
| Sierra Leoneans | 64.3 /100 | #163 | Good 4.5% |
| Swiss | 61.0 /100 | #164 | Good 4.5% |
| Costa Ricans | 59.9 /100 | #165 | Average 4.5% |
| Immigrants | Colombia | 59.4 /100 | #166 | Average 4.5% |
| Immigrants | Afghanistan | 59.2 /100 | #167 | Average 4.5% |
| Immigrants | Sierra Leone | 58.7 /100 | #168 | Average 4.5% |
| Chinese | 58.6 /100 | #169 | Average 4.5% |