Immigrants from Central America vs Immigrants from Northern Africa Master's Degree
COMPARE
Immigrants from Central America
Immigrants from Northern Africa
Master's Degree
Master's Degree Comparison
Immigrants from Central America
Immigrants from Northern Africa
10.0%
MASTER'S DEGREE
0.0/ 100
METRIC RATING
335th/ 347
METRIC RANK
17.1%
MASTER'S DEGREE
98.9/ 100
METRIC RATING
96th/ 347
METRIC RANK
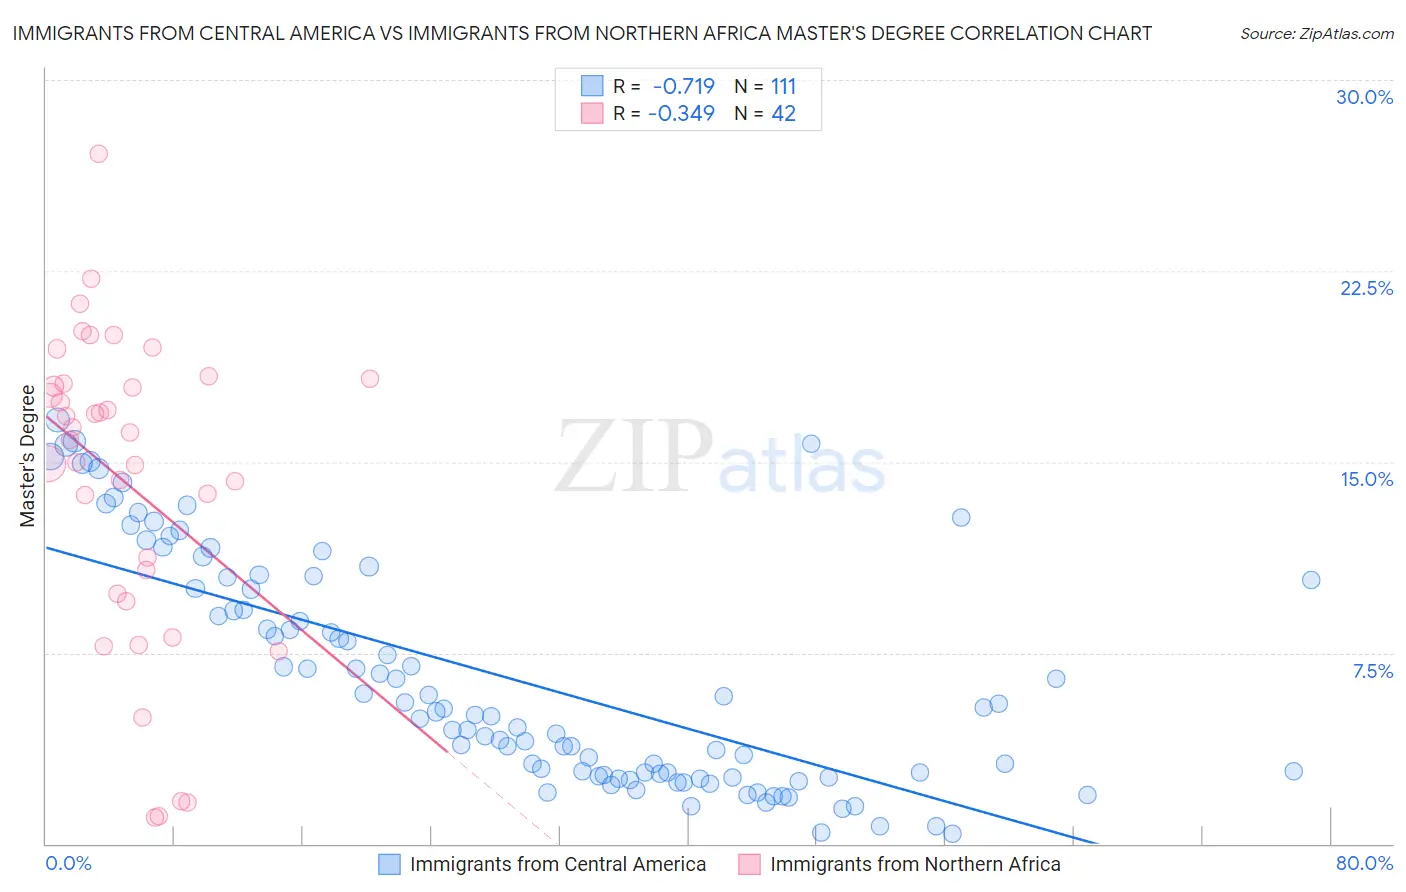
Immigrants from Central America vs Immigrants from Northern Africa Master's Degree Correlation Chart
The statistical analysis conducted on geographies consisting of 535,778,431 people shows a strong negative correlation between the proportion of Immigrants from Central America and percentage of population with at least master's degree education in the United States with a correlation coefficient (R) of -0.719 and weighted average of 10.0%. Similarly, the statistical analysis conducted on geographies consisting of 321,156,362 people shows a mild negative correlation between the proportion of Immigrants from Northern Africa and percentage of population with at least master's degree education in the United States with a correlation coefficient (R) of -0.349 and weighted average of 17.1%, a difference of 71.0%.
Master's Degree Correlation Summary
| Measurement | Immigrants from Central America | Immigrants from Northern Africa |
| Minimum | 0.37% | 1.0% |
| Maximum | 16.7% | 27.1% |
| Range | 16.3% | 26.1% |
| Mean | 6.5% | 14.2% |
| Median | 5.2% | 16.0% |
| Interquartile 25% (IQ1) | 2.7% | 9.8% |
| Interquartile 75% (IQ3) | 10.3% | 18.1% |
| Interquartile Range (IQR) | 7.6% | 8.2% |
| Standard Deviation (Sample) | 4.5% | 6.1% |
| Standard Deviation (Population) | 4.4% | 6.1% |
Similar Demographics by Master's Degree
Demographics Similar to Immigrants from Central America by Master's Degree
In terms of master's degree, the demographic groups most similar to Immigrants from Central America are Arapaho (10.0%, a difference of 0.13%), Native/Alaskan (9.9%, a difference of 0.50%), Menominee (10.2%, a difference of 2.1%), Immigrants from the Azores (10.2%, a difference of 2.5%), and Mexican (9.7%, a difference of 2.8%).
| Demographics | Rating | Rank | Master's Degree |
| Bangladeshis | 0.0 /100 | #328 | Tragic 10.5% |
| Nepalese | 0.0 /100 | #329 | Tragic 10.5% |
| Fijians | 0.0 /100 | #330 | Tragic 10.3% |
| Pueblo | 0.0 /100 | #331 | Tragic 10.3% |
| Immigrants | Azores | 0.0 /100 | #332 | Tragic 10.2% |
| Menominee | 0.0 /100 | #333 | Tragic 10.2% |
| Arapaho | 0.0 /100 | #334 | Tragic 10.0% |
| Immigrants | Central America | 0.0 /100 | #335 | Tragic 10.0% |
| Natives/Alaskans | 0.0 /100 | #336 | Tragic 9.9% |
| Mexicans | 0.0 /100 | #337 | Tragic 9.7% |
| Tohono O'odham | 0.0 /100 | #338 | Tragic 9.7% |
| Spanish American Indians | 0.0 /100 | #339 | Tragic 9.6% |
| Yakama | 0.0 /100 | #340 | Tragic 9.5% |
| Navajo | 0.0 /100 | #341 | Tragic 9.4% |
| Immigrants | Mexico | 0.0 /100 | #342 | Tragic 9.3% |
Demographics Similar to Immigrants from Northern Africa by Master's Degree
In terms of master's degree, the demographic groups most similar to Immigrants from Northern Africa are Immigrants from Morocco (17.1%, a difference of 0.030%), Immigrants from England (17.0%, a difference of 0.16%), Immigrants from Ukraine (17.0%, a difference of 0.26%), Laotian (17.0%, a difference of 0.32%), and Ugandan (17.1%, a difference of 0.34%).
| Demographics | Rating | Rank | Master's Degree |
| Bhutanese | 99.1 /100 | #89 | Exceptional 17.2% |
| Immigrants | Egypt | 99.1 /100 | #90 | Exceptional 17.2% |
| Romanians | 99.1 /100 | #91 | Exceptional 17.2% |
| Immigrants | North America | 99.1 /100 | #92 | Exceptional 17.2% |
| Immigrants | Italy | 99.1 /100 | #93 | Exceptional 17.2% |
| Ugandans | 99.0 /100 | #94 | Exceptional 17.1% |
| Immigrants | Morocco | 98.9 /100 | #95 | Exceptional 17.1% |
| Immigrants | Northern Africa | 98.9 /100 | #96 | Exceptional 17.1% |
| Immigrants | England | 98.8 /100 | #97 | Exceptional 17.0% |
| Immigrants | Ukraine | 98.8 /100 | #98 | Exceptional 17.0% |
| Laotians | 98.8 /100 | #99 | Exceptional 17.0% |
| Albanians | 98.7 /100 | #100 | Exceptional 17.0% |
| Immigrants | Nepal | 98.6 /100 | #101 | Exceptional 17.0% |
| Chileans | 98.6 /100 | #102 | Exceptional 16.9% |
| Alsatians | 98.4 /100 | #103 | Exceptional 16.9% |