Immigrants from Caribbean vs Immigrants from Bangladesh High School Diploma
COMPARE
Immigrants from Caribbean
Immigrants from Bangladesh
High School Diploma
High School Diploma Comparison
Immigrants from Caribbean
Immigrants from Bangladesh
84.3%
HIGH SCHOOL DIPLOMA
0.0/ 100
METRIC RATING
317th/ 347
METRIC RANK
85.5%
HIGH SCHOOL DIPLOMA
0.0/ 100
METRIC RATING
300th/ 347
METRIC RANK
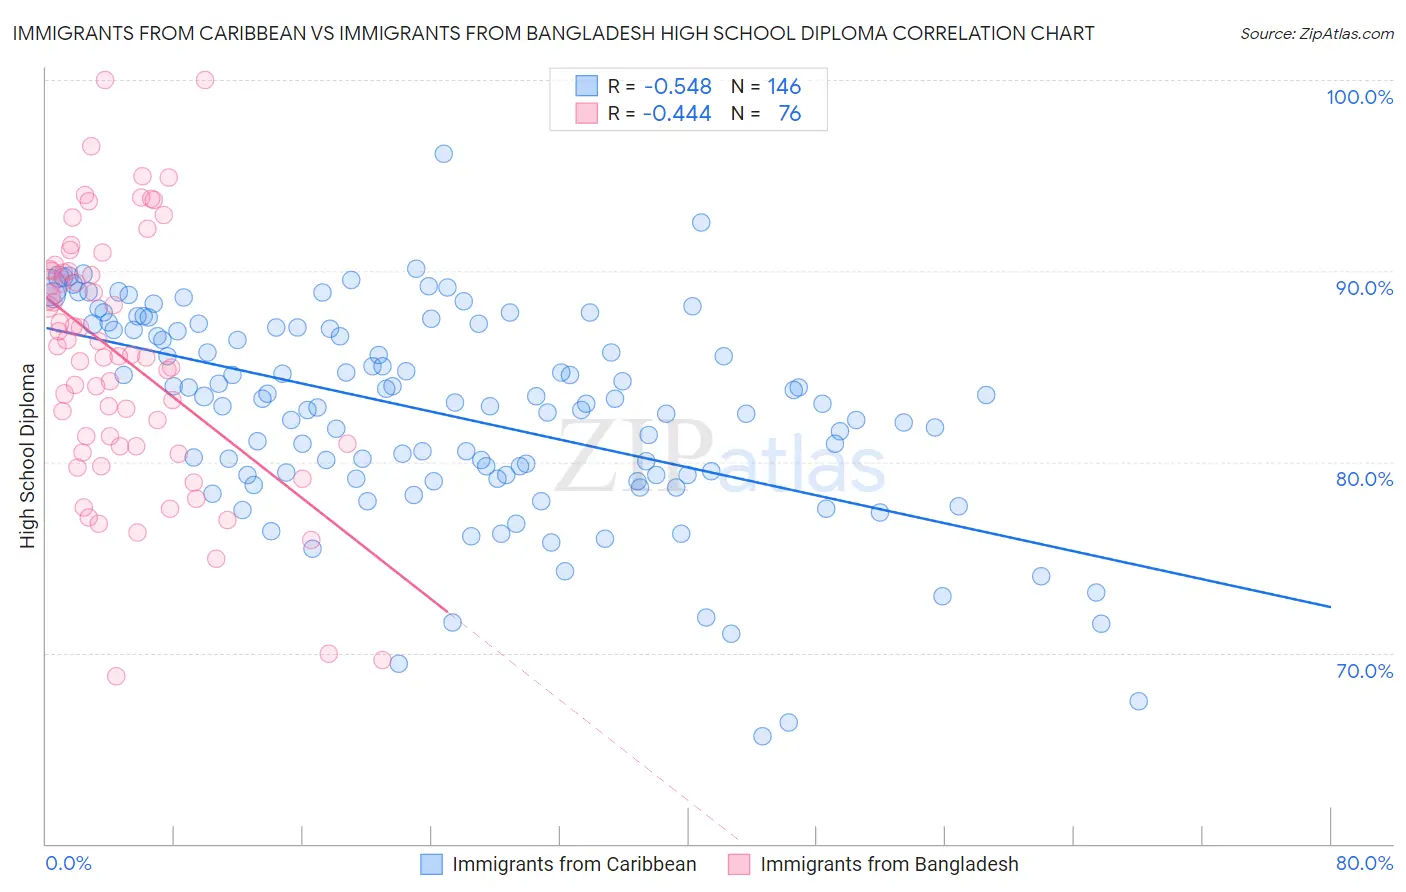
Immigrants from Caribbean vs Immigrants from Bangladesh High School Diploma Correlation Chart
The statistical analysis conducted on geographies consisting of 450,064,503 people shows a substantial negative correlation between the proportion of Immigrants from Caribbean and percentage of population with at least high school diploma education in the United States with a correlation coefficient (R) of -0.548 and weighted average of 84.3%. Similarly, the statistical analysis conducted on geographies consisting of 203,672,706 people shows a moderate negative correlation between the proportion of Immigrants from Bangladesh and percentage of population with at least high school diploma education in the United States with a correlation coefficient (R) of -0.444 and weighted average of 85.5%, a difference of 1.4%.
High School Diploma Correlation Summary
| Measurement | Immigrants from Caribbean | Immigrants from Bangladesh |
| Minimum | 65.6% | 68.8% |
| Maximum | 96.2% | 100.0% |
| Range | 30.5% | 31.2% |
| Mean | 82.5% | 85.4% |
| Median | 83.1% | 85.6% |
| Interquartile 25% (IQ1) | 79.3% | 80.8% |
| Interquartile 75% (IQ3) | 87.0% | 90.0% |
| Interquartile Range (IQR) | 7.7% | 9.1% |
| Standard Deviation (Sample) | 5.4% | 6.7% |
| Standard Deviation (Population) | 5.4% | 6.6% |
Demographics Similar to Immigrants from Caribbean and Immigrants from Bangladesh by High School Diploma
In terms of high school diploma, the demographic groups most similar to Immigrants from Caribbean are Belizean (84.3%, a difference of 0.060%), Immigrants from Belize (84.2%, a difference of 0.070%), Puerto Rican (84.7%, a difference of 0.46%), Yaqui (84.7%, a difference of 0.56%), and Immigrants from Ecuador (84.8%, a difference of 0.67%). Similarly, the demographic groups most similar to Immigrants from Bangladesh are Guyanese (85.5%, a difference of 0.020%), Vietnamese (85.4%, a difference of 0.020%), Immigrants from Haiti (85.4%, a difference of 0.060%), Cuban (85.4%, a difference of 0.060%), and Native/Alaskan (85.6%, a difference of 0.12%).
| Demographics | Rating | Rank | High School Diploma |
| Natives/Alaskans | 0.0 /100 | #298 | Tragic 85.6% |
| Guyanese | 0.0 /100 | #299 | Tragic 85.5% |
| Immigrants | Bangladesh | 0.0 /100 | #300 | Tragic 85.5% |
| Vietnamese | 0.0 /100 | #301 | Tragic 85.4% |
| Immigrants | Haiti | 0.0 /100 | #302 | Tragic 85.4% |
| Cubans | 0.0 /100 | #303 | Tragic 85.4% |
| Nepalese | 0.0 /100 | #304 | Tragic 85.3% |
| Immigrants | Portugal | 0.0 /100 | #305 | Tragic 85.3% |
| Immigrants | Guyana | 0.0 /100 | #306 | Tragic 85.3% |
| Navajo | 0.0 /100 | #307 | Tragic 85.2% |
| Immigrants | Armenia | 0.0 /100 | #308 | Tragic 85.2% |
| Immigrants | Dominica | 0.0 /100 | #309 | Tragic 85.2% |
| Apache | 0.0 /100 | #310 | Tragic 85.1% |
| Ecuadorians | 0.0 /100 | #311 | Tragic 85.1% |
| Cape Verdeans | 0.0 /100 | #312 | Tragic 85.1% |
| Immigrants | Ecuador | 0.0 /100 | #313 | Tragic 84.8% |
| Yaqui | 0.0 /100 | #314 | Tragic 84.7% |
| Puerto Ricans | 0.0 /100 | #315 | Tragic 84.7% |
| Belizeans | 0.0 /100 | #316 | Tragic 84.3% |
| Immigrants | Caribbean | 0.0 /100 | #317 | Tragic 84.3% |
| Immigrants | Belize | 0.0 /100 | #318 | Tragic 84.2% |