Immigrants from Southern Europe vs Bulgarian 10th Grade
COMPARE
Immigrants from Southern Europe
Bulgarian
10th Grade
10th Grade Comparison
Immigrants from Southern Europe
Bulgarians
93.2%
10TH GRADE
8.9/ 100
METRIC RATING
221st/ 347
METRIC RANK
95.4%
10TH GRADE
100.0/ 100
METRIC RATING
29th/ 347
METRIC RANK
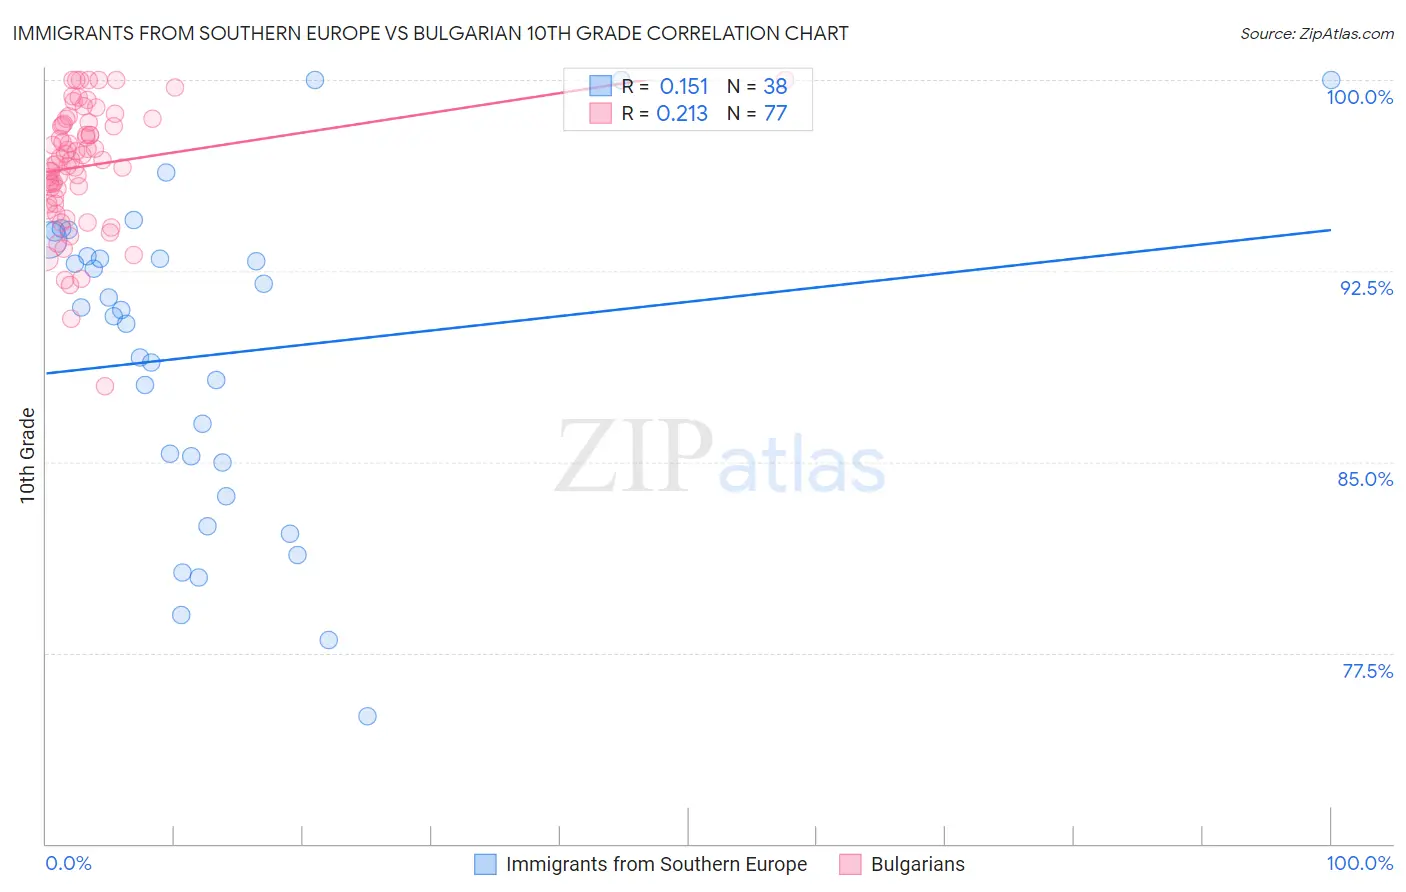
Immigrants from Southern Europe vs Bulgarian 10th Grade Correlation Chart
The statistical analysis conducted on geographies consisting of 402,804,595 people shows a poor positive correlation between the proportion of Immigrants from Southern Europe and percentage of population with at least 10th grade education in the United States with a correlation coefficient (R) of 0.151 and weighted average of 93.2%. Similarly, the statistical analysis conducted on geographies consisting of 205,632,748 people shows a weak positive correlation between the proportion of Bulgarians and percentage of population with at least 10th grade education in the United States with a correlation coefficient (R) of 0.213 and weighted average of 95.4%, a difference of 2.3%.
10th Grade Correlation Summary
| Measurement | Immigrants from Southern Europe | Bulgarian |
| Minimum | 75.0% | 88.0% |
| Maximum | 100.0% | 100.0% |
| Range | 25.0% | 12.0% |
| Mean | 89.2% | 96.6% |
| Median | 90.8% | 96.8% |
| Interquartile 25% (IQ1) | 85.0% | 95.3% |
| Interquartile 75% (IQ3) | 93.1% | 98.3% |
| Interquartile Range (IQR) | 8.1% | 3.0% |
| Standard Deviation (Sample) | 6.3% | 2.4% |
| Standard Deviation (Population) | 6.2% | 2.4% |
Similar Demographics by 10th Grade
Demographics Similar to Immigrants from Southern Europe by 10th Grade
In terms of 10th grade, the demographic groups most similar to Immigrants from Southern Europe are Tongan (93.3%, a difference of 0.020%), Ethiopian (93.2%, a difference of 0.030%), Immigrants from Liberia (93.3%, a difference of 0.040%), Seminole (93.3%, a difference of 0.040%), and Immigrants from Sierra Leone (93.2%, a difference of 0.040%).
| Demographics | Rating | Rank | 10th Grade |
| Immigrants | Bahamas | 15.2 /100 | #214 | Poor 93.4% |
| Immigrants | Oceania | 15.1 /100 | #215 | Poor 93.4% |
| Immigrants | Eastern Africa | 14.7 /100 | #216 | Poor 93.4% |
| Portuguese | 12.1 /100 | #217 | Poor 93.3% |
| Immigrants | Liberia | 10.2 /100 | #218 | Poor 93.3% |
| Seminole | 10.2 /100 | #219 | Poor 93.3% |
| Tongans | 9.5 /100 | #220 | Tragic 93.3% |
| Immigrants | Southern Europe | 8.9 /100 | #221 | Tragic 93.2% |
| Ethiopians | 7.9 /100 | #222 | Tragic 93.2% |
| Immigrants | Sierra Leone | 7.6 /100 | #223 | Tragic 93.2% |
| Bolivians | 6.7 /100 | #224 | Tragic 93.2% |
| Somalis | 6.2 /100 | #225 | Tragic 93.2% |
| Koreans | 6.1 /100 | #226 | Tragic 93.2% |
| Blacks/African Americans | 6.0 /100 | #227 | Tragic 93.2% |
| Immigrants | China | 5.9 /100 | #228 | Tragic 93.2% |
Demographics Similar to Bulgarians by 10th Grade
In terms of 10th grade, the demographic groups most similar to Bulgarians are Alaskan Athabascan (95.4%, a difference of 0.030%), Luxembourger (95.4%, a difference of 0.030%), Welsh (95.5%, a difference of 0.050%), Belgian (95.4%, a difference of 0.050%), and European (95.5%, a difference of 0.070%).
| Demographics | Rating | Rank | 10th Grade |
| Eastern Europeans | 100.0 /100 | #22 | Exceptional 95.5% |
| Czechs | 100.0 /100 | #23 | Exceptional 95.5% |
| Europeans | 100.0 /100 | #24 | Exceptional 95.5% |
| Maltese | 100.0 /100 | #25 | Exceptional 95.5% |
| Welsh | 100.0 /100 | #26 | Exceptional 95.5% |
| Alaskan Athabascans | 100.0 /100 | #27 | Exceptional 95.4% |
| Luxembourgers | 100.0 /100 | #28 | Exceptional 95.4% |
| Bulgarians | 100.0 /100 | #29 | Exceptional 95.4% |
| Belgians | 100.0 /100 | #30 | Exceptional 95.4% |
| Iranians | 100.0 /100 | #31 | Exceptional 95.3% |
| Hungarians | 100.0 /100 | #32 | Exceptional 95.3% |
| French | 100.0 /100 | #33 | Exceptional 95.3% |
| British | 99.9 /100 | #34 | Exceptional 95.3% |
| Estonians | 99.9 /100 | #35 | Exceptional 95.3% |
| Immigrants | India | 99.9 /100 | #36 | Exceptional 95.3% |