Immigrants from Canada vs Israeli 9th Grade
COMPARE
Immigrants from Canada
Israeli
9th Grade
9th Grade Comparison
Immigrants from Canada
Israelis
96.0%
9TH GRADE
99.8/ 100
METRIC RATING
54th/ 347
METRIC RANK
95.3%
9TH GRADE
90.4/ 100
METRIC RATING
133rd/ 347
METRIC RANK
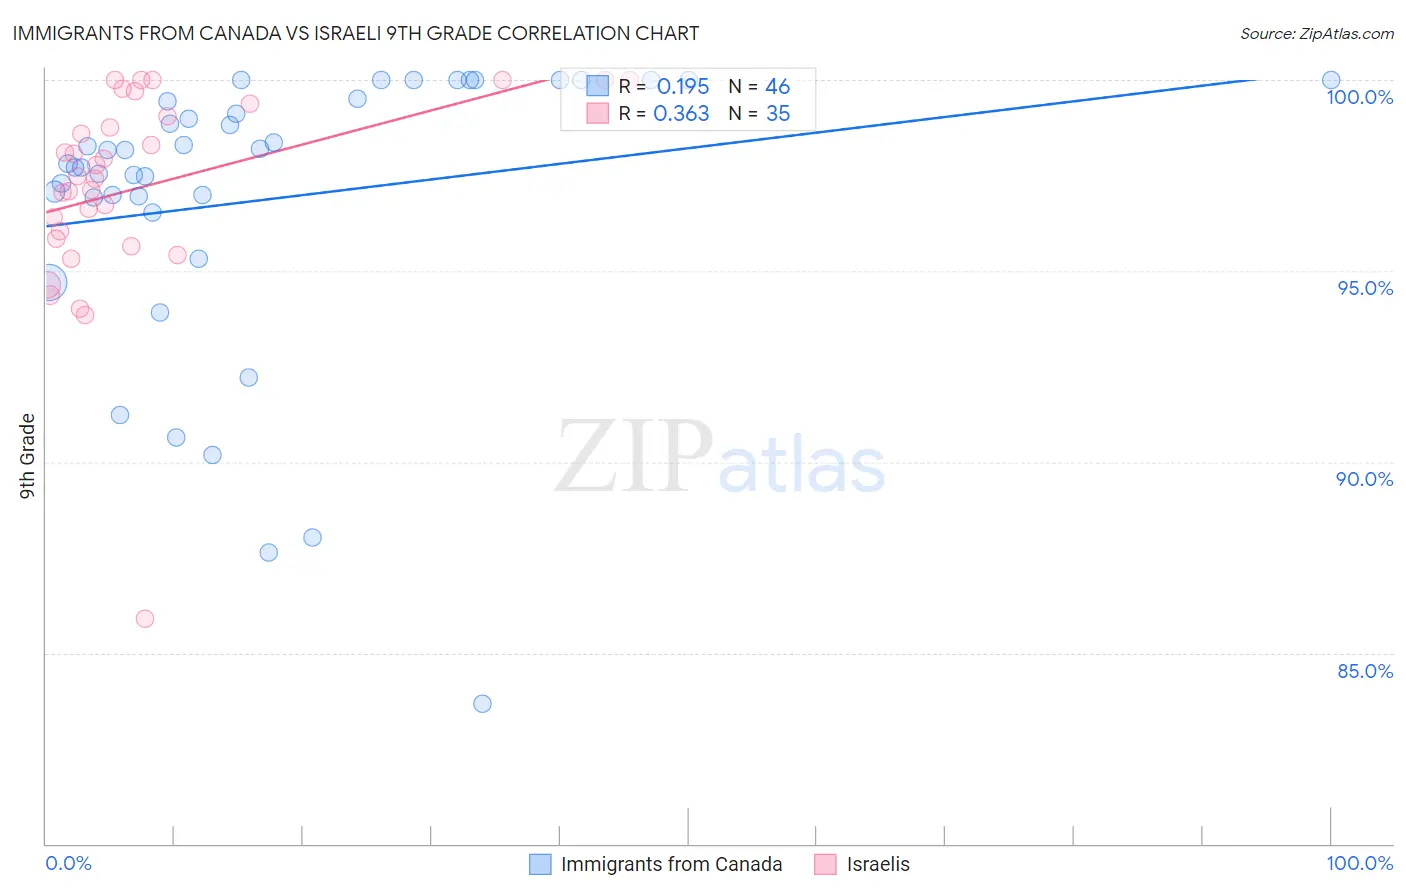
Immigrants from Canada vs Israeli 9th Grade Correlation Chart
The statistical analysis conducted on geographies consisting of 459,397,383 people shows a poor positive correlation between the proportion of Immigrants from Canada and percentage of population with at least 9th grade education in the United States with a correlation coefficient (R) of 0.195 and weighted average of 96.0%. Similarly, the statistical analysis conducted on geographies consisting of 211,220,151 people shows a mild positive correlation between the proportion of Israelis and percentage of population with at least 9th grade education in the United States with a correlation coefficient (R) of 0.363 and weighted average of 95.3%, a difference of 0.76%.
9th Grade Correlation Summary
| Measurement | Immigrants from Canada | Israeli |
| Minimum | 83.7% | 85.9% |
| Maximum | 100.0% | 100.0% |
| Range | 16.3% | 14.1% |
| Mean | 96.9% | 97.2% |
| Median | 98.0% | 97.5% |
| Interquartile 25% (IQ1) | 96.9% | 95.8% |
| Interquartile 75% (IQ3) | 99.5% | 99.4% |
| Interquartile Range (IQR) | 2.6% | 3.5% |
| Standard Deviation (Sample) | 3.8% | 2.7% |
| Standard Deviation (Population) | 3.7% | 2.7% |
Similar Demographics by 9th Grade
Demographics Similar to Immigrants from Canada by 9th Grade
In terms of 9th grade, the demographic groups most similar to Immigrants from Canada are Austrian (96.0%, a difference of 0.010%), Immigrants from Austria (96.0%, a difference of 0.010%), Serbian (96.0%, a difference of 0.020%), Immigrants from North America (96.0%, a difference of 0.020%), and Immigrants from Northern Europe (96.0%, a difference of 0.030%).
| Demographics | Rating | Rank | 9th Grade |
| Russians | 99.9 /100 | #47 | Exceptional 96.0% |
| Australians | 99.9 /100 | #48 | Exceptional 96.0% |
| Greeks | 99.9 /100 | #49 | Exceptional 96.0% |
| Celtics | 99.9 /100 | #50 | Exceptional 96.0% |
| Immigrants | Northern Europe | 99.9 /100 | #51 | Exceptional 96.0% |
| Serbians | 99.9 /100 | #52 | Exceptional 96.0% |
| Austrians | 99.8 /100 | #53 | Exceptional 96.0% |
| Immigrants | Canada | 99.8 /100 | #54 | Exceptional 96.0% |
| Immigrants | Austria | 99.8 /100 | #55 | Exceptional 96.0% |
| Immigrants | North America | 99.8 /100 | #56 | Exceptional 96.0% |
| Macedonians | 99.8 /100 | #57 | Exceptional 96.0% |
| Aleuts | 99.8 /100 | #58 | Exceptional 96.0% |
| New Zealanders | 99.8 /100 | #59 | Exceptional 95.9% |
| Native Hawaiians | 99.8 /100 | #60 | Exceptional 95.9% |
| Sioux | 99.8 /100 | #61 | Exceptional 95.9% |
Demographics Similar to Israelis by 9th Grade
In terms of 9th grade, the demographic groups most similar to Israelis are Immigrants from Israel (95.3%, a difference of 0.020%), Nonimmigrants (95.3%, a difference of 0.030%), Immigrants from Belarus (95.2%, a difference of 0.030%), Immigrants from North Macedonia (95.3%, a difference of 0.040%), and Immigrants from Iran (95.2%, a difference of 0.040%).
| Demographics | Rating | Rank | 9th Grade |
| Immigrants | Serbia | 94.4 /100 | #126 | Exceptional 95.4% |
| Palestinians | 94.3 /100 | #127 | Exceptional 95.4% |
| Immigrants | Hungary | 94.2 /100 | #128 | Exceptional 95.4% |
| Basques | 94.1 /100 | #129 | Exceptional 95.4% |
| Jordanians | 93.5 /100 | #130 | Exceptional 95.3% |
| Immigrants | North Macedonia | 92.3 /100 | #131 | Exceptional 95.3% |
| Immigrants | Nonimmigrants | 92.0 /100 | #132 | Exceptional 95.3% |
| Israelis | 90.4 /100 | #133 | Exceptional 95.3% |
| Immigrants | Israel | 89.6 /100 | #134 | Excellent 95.3% |
| Immigrants | Belarus | 88.9 /100 | #135 | Excellent 95.2% |
| Immigrants | Iran | 88.3 /100 | #136 | Excellent 95.2% |
| Hmong | 87.7 /100 | #137 | Excellent 95.2% |
| Immigrants | Russia | 86.6 /100 | #138 | Excellent 95.2% |
| Immigrants | Eastern Europe | 85.8 /100 | #139 | Excellent 95.2% |
| Immigrants | Taiwan | 85.3 /100 | #140 | Excellent 95.2% |