Immigrants from Canada vs Israeli Disability Age 35 to 64

COMPARE

Immigrants from Canada
Race
Ancestry
AfghanAfricanAlaska NativeAlaskan AthabascanAlbanianAleutAlsatianAmericanApacheArabArapahoArgentineanArmenianAssyrian/Chaldean/SyriacAustralianAustrianBahamianBangladeshiBarbadianBasqueBelgianBelizeanBermudanBhutaneseBlackfeetBolivianBrazilianBritishBritish West IndianBulgarianBurmeseCajunCambodianCanadianCape VerdeanCarpatho RusynCelticCentral AmericanCentral American IndianCherokeeCheyenneChickasawChileanChineseChippewaChoctawColombianColvilleComancheCosta RicanCreeCreekCroatianCrowCubanCypriotCzechCzechoslovakianDanishDelawareDominicanDutchDutch West IndianEastern EuropeanEcuadorianEgyptianEnglishEstonianEthiopianEuropeanFijianFilipinoFinnishFrenchFrench American IndianFrench CanadianGermanGerman RussianGhanaianGreekGuamanian/ChamorroGuatemalanGuyaneseHaitianHmongHonduranHopiHoumaHungarianIcelanderIndian (Asian)IndonesianInupiatIranianIraqiIrishIroquoisItalianJamaicanJapaneseJordanianKenyanKiowaKoreanLaotianLatvianLebaneseLiberianLithuanianLumbeeLuxembourgerMacedonianMalaysianMalteseMarshalleseMenomineeMexicanMexican American IndianMongolianMoroccanNative HawaiianNavajoNepaleseNew ZealanderNicaraguanNigerianNorthern EuropeanNorwegianOkinawanOsageOttawaPaiutePakistaniPalestinianPanamanianParaguayanPennsylvania GermanPeruvianPimaPolishPortuguesePotawatomiPuebloPuerto RicanPuget Sound SalishRomanianRussianSalvadoranSamoanScandinavianScotch-IrishScottishSeminoleSenegaleseSerbianShoshoneSierra LeoneanSiouxSlavicSlovakSloveneSomaliSouth AfricanSouth AmericanSouth American IndianSoviet UnionSpaniardSpanishSpanish AmericanSpanish American IndianSri LankanSubsaharan AfricanSudaneseSwedishSwissSyrianTaiwaneseThaiTlingit-HaidaTohono O'OdhamTonganTrinidadian and TobagonianTsimshianTurkishU.S. Virgin IslanderUgandanUkrainianUruguayanUteVenezuelanVietnameseWelshWest IndianYakamaYaquiYugoslavianYumanYup'ikZimbabwean
Immigration
NonimmigrantsImmigrantsAfghanistanAfricaAlbaniaArgentinaArmeniaAsiaAustraliaAustriaBahamasBangladeshBarbadosBelarusBelgiumBelizeBoliviaBosnia and HerzegovinaBrazilBulgariaBurma/MyanmarCabo VerdeCambodiaCameroonCanadaCaribbeanCentral AmericaChileChinaColombiaCongoCosta RicaCroatiaCubaCzechoslovakiaDenmarkDominicaDominican RepublicEastern AfricaEastern AsiaEastern EuropeEcuadorEgyptEl SalvadorEnglandEritreaEthiopiaEuropeFijiFranceGermanyGhanaGreeceGrenadaGuatemalaGuyanaHaitiHondurasHong KongHungaryIndiaIndonesiaIranIraqIrelandIsraelItalyJamaicaJapanJordanKazakhstanKenyaKoreaKuwaitLaosLatin AmericaLatviaLebanonLiberiaLithuaniaMalaysiaMexicoMicronesiaMiddle AfricaMoldovaMoroccoNepalNetherlandsNicaraguaNigeriaNorth AmericaNorth MacedoniaNorthern AfricaNorthern EuropeNorwayOceaniaPakistanPanamaPeruPhilippinesPolandPortugalRomaniaRussiaSaudi ArabiaScotlandSenegalSerbiaSierra LeoneSingaporeSomaliaSouth AfricaSouth AmericaSouth Central AsiaSouth Eastern AsiaSouthern EuropeSpainSri LankaSt. Vincent and the GrenadinesSudanSwedenSwitzerlandSyriaTaiwanThailandTrinidad and TobagoTurkeyUgandaUkraineUruguayUzbekistanVenezuelaVietnamWest IndiesWestern AfricaWestern AsiaWestern EuropeYemenZaireZimbabweAzores
Israeli
Race
Ancestry
AfghanAfricanAlaska NativeAlaskan AthabascanAlbanianAleutAlsatianAmericanApacheArabArapahoArgentineanArmenianAssyrian/Chaldean/SyriacAustralianAustrianBahamianBangladeshiBarbadianBasqueBelgianBelizeanBermudanBhutaneseBlackfeetBolivianBrazilianBritishBritish West IndianBulgarianBurmeseCajunCambodianCanadianCape VerdeanCarpatho RusynCelticCentral AmericanCentral American IndianCherokeeCheyenneChickasawChileanChineseChippewaChoctawColombianColvilleComancheCosta RicanCreeCreekCroatianCrowCubanCypriotCzechCzechoslovakianDanishDelawareDominicanDutchDutch West IndianEastern EuropeanEcuadorianEgyptianEnglishEstonianEthiopianEuropeanFijianFilipinoFinnishFrenchFrench American IndianFrench CanadianGermanGerman RussianGhanaianGreekGuamanian/ChamorroGuatemalanGuyaneseHaitianHmongHonduranHopiHoumaHungarianIcelanderIndian (Asian)IndonesianInupiatIranianIraqiIrishIroquoisIsraeliItalianJamaicanJapaneseJordanianKenyanKiowaKoreanLaotianLatvianLebaneseLiberianLithuanianLumbeeLuxembourgerMacedonianMalaysianMalteseMarshalleseMenomineeMexicanMexican American IndianMongolianMoroccanNative HawaiianNavajoNepaleseNew ZealanderNicaraguanNigerianNorthern EuropeanNorwegianOkinawanOsageOttawaPaiutePakistaniPalestinianPanamanianParaguayanPennsylvania GermanPeruvianPimaPolishPortuguesePotawatomiPuebloPuerto RicanPuget Sound SalishRomanianRussianSalvadoranSamoanScandinavianScotch-IrishScottishSeminoleSenegaleseSerbianShoshoneSierra LeoneanSiouxSlavicSlovakSloveneSomaliSouth AfricanSouth AmericanSouth American IndianSoviet UnionSpaniardSpanishSpanish AmericanSpanish American IndianSri LankanSubsaharan AfricanSudaneseSwedishSwissSyrianTaiwaneseThaiTlingit-HaidaTohono O'OdhamTonganTrinidadian and TobagonianTsimshianTurkishU.S. Virgin IslanderUgandanUkrainianUruguayanUteVenezuelanVietnameseWelshWest IndianYakamaYaquiYugoslavianYumanYup'ikZimbabwean
Immigration
NonimmigrantsImmigrantsAfghanistanAfricaAlbaniaArgentinaArmeniaAsiaAustraliaAustriaBahamasBangladeshBarbadosBelarusBelgiumBelizeBoliviaBosnia and HerzegovinaBrazilBulgariaBurma/MyanmarCabo VerdeCambodiaCameroonCaribbeanCentral AmericaChileChinaColombiaCongoCosta RicaCroatiaCubaCzechoslovakiaDenmarkDominicaDominican RepublicEastern AfricaEastern AsiaEastern EuropeEcuadorEgyptEl SalvadorEnglandEritreaEthiopiaEuropeFijiFranceGermanyGhanaGreeceGrenadaGuatemalaGuyanaHaitiHondurasHong KongHungaryIndiaIndonesiaIranIraqIrelandIsraelItalyJamaicaJapanJordanKazakhstanKenyaKoreaKuwaitLaosLatin AmericaLatviaLebanonLiberiaLithuaniaMalaysiaMexicoMicronesiaMiddle AfricaMoldovaMoroccoNepalNetherlandsNicaraguaNigeriaNorth AmericaNorth MacedoniaNorthern AfricaNorthern EuropeNorwayOceaniaPakistanPanamaPeruPhilippinesPolandPortugalRomaniaRussiaSaudi ArabiaScotlandSenegalSerbiaSierra LeoneSingaporeSomaliaSouth AfricaSouth AmericaSouth Central AsiaSouth Eastern AsiaSouthern EuropeSpainSri LankaSt. Vincent and the GrenadinesSudanSwedenSwitzerlandSyriaTaiwanThailandTrinidad and TobagoTurkeyUgandaUkraineUruguayUzbekistanVenezuelaVietnamWest IndiesWestern AfricaWestern AsiaWestern EuropeYemenZaireZimbabweAzores
Disability Age 35 to 64
Income
Poverty
Unemployment
Labor Participation
Family Structure
Vehicle Availability
Education Level
Disability

Disability Age 35 to 64 Comparison

Immigrants from Canada

Israelis

Good
Exceptional
11.0%
DISABILITY AGE 35 TO 64
76.7/ 100
METRIC RATING
154th/ 347
METRIC RANK
9.7%
DISABILITY AGE 35 TO 64
99.9/ 100
METRIC RATING
41st/ 347
METRIC RANK

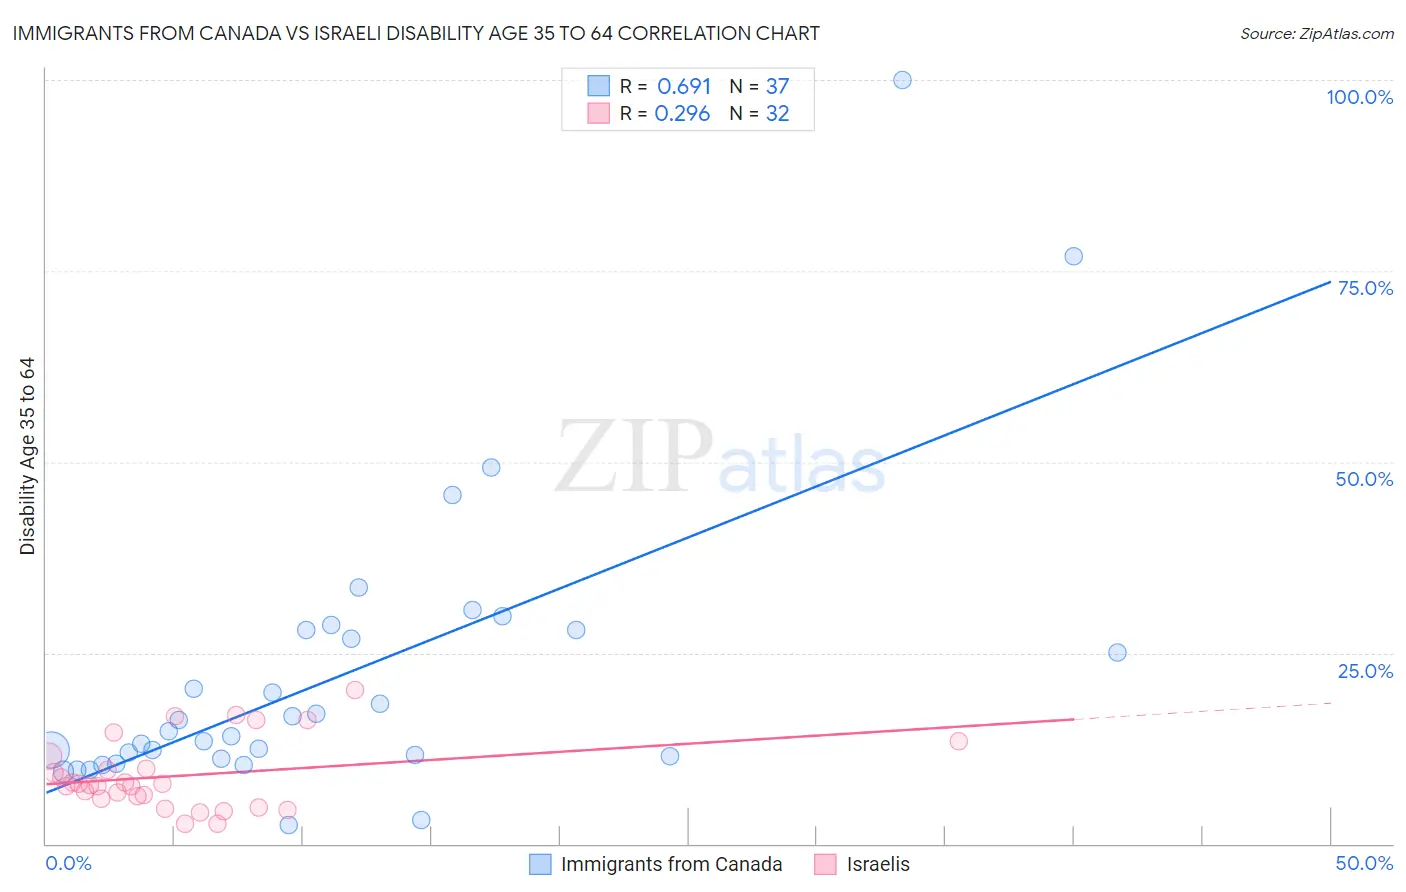
Immigrants from Canada vs Israeli Disability Age 35 to 64 Correlation Chart

The statistical analysis conducted on geographies consisting of 459,003,315 people shows a significant positive correlation between the proportion of Immigrants from Canada and percentage of population with a disability between the ages 34 and 64 in the United States with a correlation coefficient (R) of 0.691 and weighted average of 11.0%. Similarly, the statistical analysis conducted on geographies consisting of 210,999,934 people shows a weak positive correlation between the proportion of Israelis and percentage of population with a disability between the ages 34 and 64 in the United States with a correlation coefficient (R) of 0.296 and weighted average of 9.7%, a difference of 13.1%.
Immigrants from Canada vs Israeli Disability Age 35 to 64

Disability Age 35 to 64 Correlation Summary

MeasurementImmigrants from CanadaIsraeli
Minimum2.4%2.6%
Maximum100.0%20.2%
Range97.6%17.5%
Mean22.0%8.9%
Median14.8%7.7%
Interquartile 25% (IQ1)11.3%6.1%
Interquartile 75% (IQ3)28.0%10.6%
Interquartile Range (IQR)16.7%4.5%
Standard Deviation (Sample)19.4%4.5%
Standard Deviation (Population)19.1%4.5%

Similar Demographics by Disability Age 35 to 64

Demographics Similar to Immigrants from Canada by Disability Age 35 to 64

In terms of disability age 35 to 64, the demographic groups most similar to Immigrants from Canada are Moroccan (11.0%, a difference of 0.040%), Immigrants from Sierra Leone (11.0%, a difference of 0.060%), Immigrants from England (11.0%, a difference of 0.080%), Ukrainian (11.0%, a difference of 0.15%), and Guyanese (11.0%, a difference of 0.19%).
DemographicsRating | RankDisability Age 35 to 64
Immigrants | Eritrea
83.4
/100
|
#147
Excellent
10.9%
Arabs
82.7
/100
|
#148
Excellent
10.9%
Immigrants | Cameroon
81.1
/100
|
#149
Excellent
10.9%
Syrians
79.8
/100
|
#150
Good
11.0%
New Zealanders
79.3
/100
|
#151
Good
11.0%
Ukrainians
78.0
/100
|
#152
Good
11.0%
Immigrants | England
77.4
/100
|
#153
Good
11.0%
Immigrants | Canada
76.7
/100
|
#154
Good
11.0%
Moroccans
76.4
/100
|
#155
Good
11.0%
Immigrants | Sierra Leone
76.2
/100
|
#156
Good
11.0%
Guyanese
75.1
/100
|
#157
Good
11.0%
Immigrants | North America
74.9
/100
|
#158
Good
11.0%
Serbians
73.6
/100
|
#159
Good
11.0%
Croatians
73.1
/100
|
#160
Good
11.0%
Immigrants | Guyana
70.1
/100
|
#161
Good
11.1%

Demographics Similar to Israelis by Disability Age 35 to 64

In terms of disability age 35 to 64, the demographic groups most similar to Israelis are Immigrants from Armenia (9.7%, a difference of 0.12%), Immigrants from Belarus (9.7%, a difference of 0.18%), Immigrants from Malaysia (9.7%, a difference of 0.23%), Egyptian (9.7%, a difference of 0.35%), and Immigrants from Colombia (9.8%, a difference of 0.35%).
DemographicsRating | RankDisability Age 35 to 64
Immigrants | Australia
99.9
/100
|
#34
Exceptional
9.7%
Bulgarians
99.9
/100
|
#35
Exceptional
9.7%
Immigrants | Cuba
99.9
/100
|
#36
Exceptional
9.7%
Immigrants | Turkey
99.9
/100
|
#37
Exceptional
9.7%
Egyptians
99.9
/100
|
#38
Exceptional
9.7%
Immigrants | Belarus
99.9
/100
|
#39
Exceptional
9.7%
Immigrants | Armenia
99.9
/100
|
#40
Exceptional
9.7%
Israelis
99.9
/100
|
#41
Exceptional
9.7%
Immigrants | Malaysia
99.9
/100
|
#42
Exceptional
9.7%
Immigrants | Colombia
99.9
/100
|
#43
Exceptional
9.8%
Immigrants | Egypt
99.9
/100
|
#44
Exceptional
9.8%
Immigrants | Peru
99.9
/100
|
#45
Exceptional
9.8%
Cambodians
99.8
/100
|
#46
Exceptional
9.8%
Immigrants | Belgium
99.8
/100
|
#47
Exceptional
9.8%
Immigrants | Serbia
99.8
/100
|
#48
Exceptional
9.8%