Immigrants from Cameroon vs Israeli 9th Grade
COMPARE
Immigrants from Cameroon
Israeli
9th Grade
9th Grade Comparison
Immigrants from Cameroon
Israelis
94.2%
9TH GRADE
2.1/ 100
METRIC RATING
243rd/ 347
METRIC RANK
95.3%
9TH GRADE
90.4/ 100
METRIC RATING
133rd/ 347
METRIC RANK
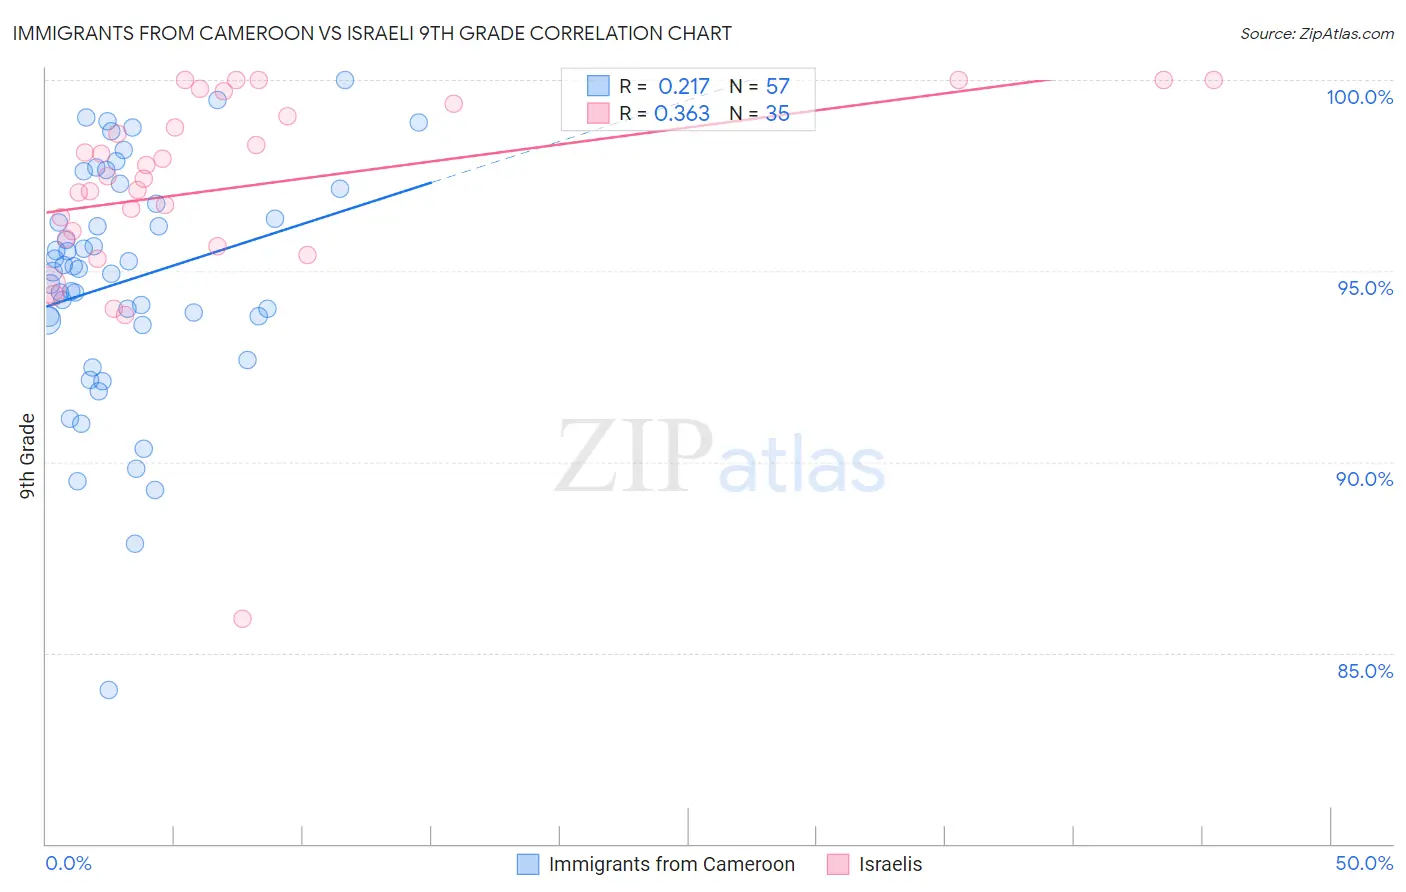
Immigrants from Cameroon vs Israeli 9th Grade Correlation Chart
The statistical analysis conducted on geographies consisting of 130,618,704 people shows a weak positive correlation between the proportion of Immigrants from Cameroon and percentage of population with at least 9th grade education in the United States with a correlation coefficient (R) of 0.217 and weighted average of 94.2%. Similarly, the statistical analysis conducted on geographies consisting of 211,220,151 people shows a mild positive correlation between the proportion of Israelis and percentage of population with at least 9th grade education in the United States with a correlation coefficient (R) of 0.363 and weighted average of 95.3%, a difference of 1.1%.
9th Grade Correlation Summary
| Measurement | Immigrants from Cameroon | Israeli |
| Minimum | 84.0% | 85.9% |
| Maximum | 100.0% | 100.0% |
| Range | 16.0% | 14.1% |
| Mean | 94.7% | 97.2% |
| Median | 95.1% | 97.5% |
| Interquartile 25% (IQ1) | 93.7% | 95.8% |
| Interquartile 75% (IQ3) | 97.0% | 99.4% |
| Interquartile Range (IQR) | 3.3% | 3.5% |
| Standard Deviation (Sample) | 3.1% | 2.7% |
| Standard Deviation (Population) | 3.1% | 2.7% |
Similar Demographics by 9th Grade
Demographics Similar to Immigrants from Cameroon by 9th Grade
In terms of 9th grade, the demographic groups most similar to Immigrants from Cameroon are Immigrants from Middle Africa (94.2%, a difference of 0.0%), Dutch West Indian (94.2%, a difference of 0.010%), Paiute (94.2%, a difference of 0.020%), Senegalese (94.2%, a difference of 0.020%), and Afghan (94.2%, a difference of 0.030%).
| Demographics | Rating | Rank | 9th Grade |
| Somalis | 2.9 /100 | #236 | Tragic 94.3% |
| Koreans | 2.9 /100 | #237 | Tragic 94.3% |
| South American Indians | 2.8 /100 | #238 | Tragic 94.3% |
| Immigrants | China | 2.8 /100 | #239 | Tragic 94.3% |
| Immigrants | Ethiopia | 2.7 /100 | #240 | Tragic 94.3% |
| Spanish Americans | 2.6 /100 | #241 | Tragic 94.2% |
| Immigrants | Middle Africa | 2.2 /100 | #242 | Tragic 94.2% |
| Immigrants | Cameroon | 2.1 /100 | #243 | Tragic 94.2% |
| Dutch West Indians | 2.0 /100 | #244 | Tragic 94.2% |
| Paiute | 1.9 /100 | #245 | Tragic 94.2% |
| Senegalese | 1.9 /100 | #246 | Tragic 94.2% |
| Afghans | 1.8 /100 | #247 | Tragic 94.2% |
| Immigrants | Somalia | 1.4 /100 | #248 | Tragic 94.1% |
| Uruguayans | 1.3 /100 | #249 | Tragic 94.1% |
| Immigrants | Hong Kong | 1.3 /100 | #250 | Tragic 94.1% |
Demographics Similar to Israelis by 9th Grade
In terms of 9th grade, the demographic groups most similar to Israelis are Immigrants from Israel (95.3%, a difference of 0.020%), Nonimmigrants (95.3%, a difference of 0.030%), Immigrants from Belarus (95.2%, a difference of 0.030%), Immigrants from North Macedonia (95.3%, a difference of 0.040%), and Immigrants from Iran (95.2%, a difference of 0.040%).
| Demographics | Rating | Rank | 9th Grade |
| Immigrants | Serbia | 94.4 /100 | #126 | Exceptional 95.4% |
| Palestinians | 94.3 /100 | #127 | Exceptional 95.4% |
| Immigrants | Hungary | 94.2 /100 | #128 | Exceptional 95.4% |
| Basques | 94.1 /100 | #129 | Exceptional 95.4% |
| Jordanians | 93.5 /100 | #130 | Exceptional 95.3% |
| Immigrants | North Macedonia | 92.3 /100 | #131 | Exceptional 95.3% |
| Immigrants | Nonimmigrants | 92.0 /100 | #132 | Exceptional 95.3% |
| Israelis | 90.4 /100 | #133 | Exceptional 95.3% |
| Immigrants | Israel | 89.6 /100 | #134 | Excellent 95.3% |
| Immigrants | Belarus | 88.9 /100 | #135 | Excellent 95.2% |
| Immigrants | Iran | 88.3 /100 | #136 | Excellent 95.2% |
| Hmong | 87.7 /100 | #137 | Excellent 95.2% |
| Immigrants | Russia | 86.6 /100 | #138 | Excellent 95.2% |
| Immigrants | Eastern Europe | 85.8 /100 | #139 | Excellent 95.2% |
| Immigrants | Taiwan | 85.3 /100 | #140 | Excellent 95.2% |