Immigrants from Canada vs Immigrants from El Salvador 9th Grade
COMPARE
Immigrants from Canada
Immigrants from El Salvador
9th Grade
9th Grade Comparison
Immigrants from Canada
Immigrants from El Salvador
96.0%
9TH GRADE
99.8/ 100
METRIC RATING
54th/ 347
METRIC RANK
89.0%
9TH GRADE
0.0/ 100
METRIC RATING
344th/ 347
METRIC RANK
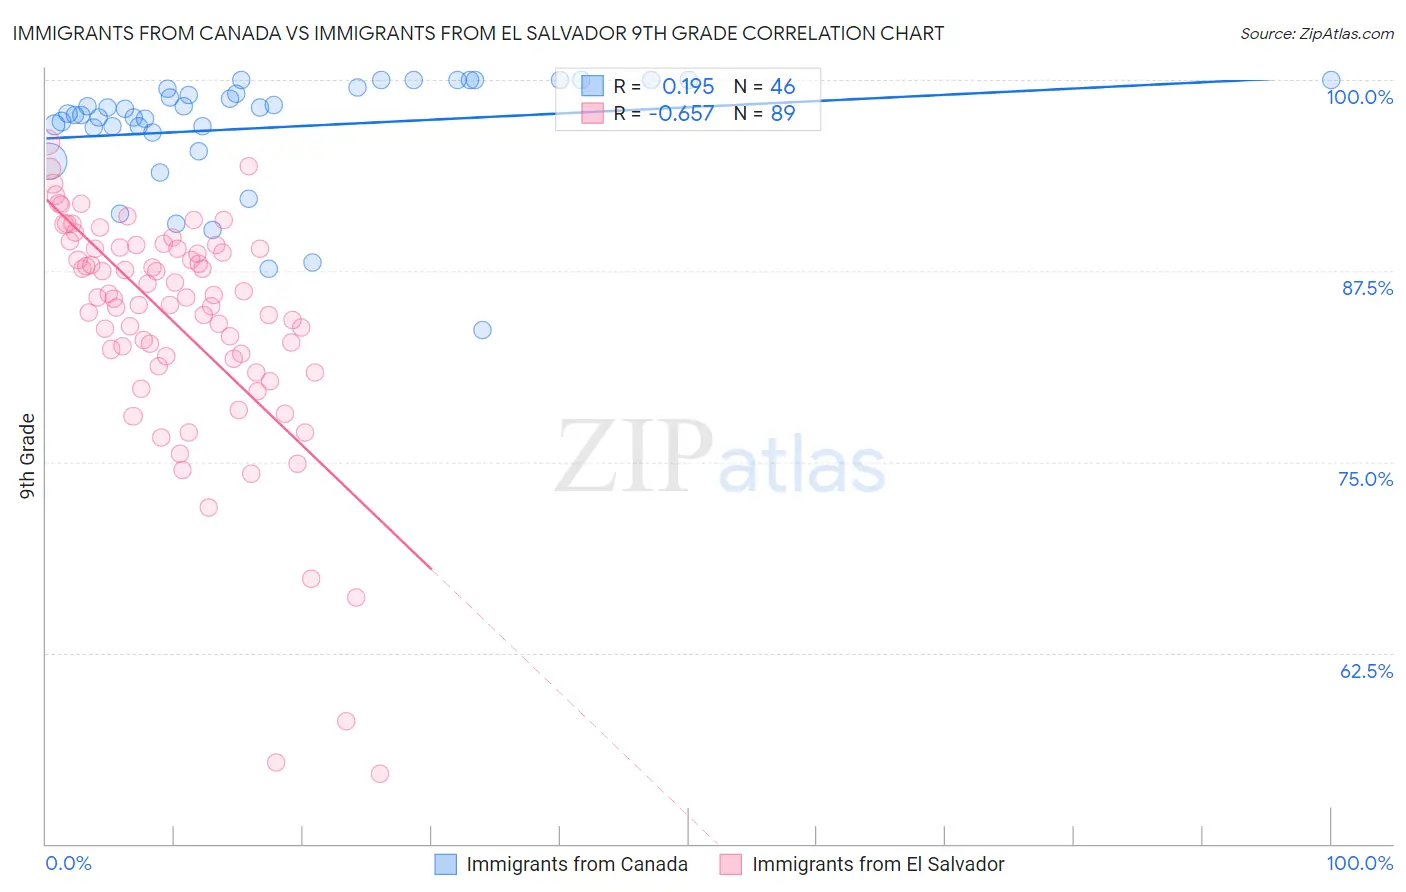
Immigrants from Canada vs Immigrants from El Salvador 9th Grade Correlation Chart
The statistical analysis conducted on geographies consisting of 459,397,383 people shows a poor positive correlation between the proportion of Immigrants from Canada and percentage of population with at least 9th grade education in the United States with a correlation coefficient (R) of 0.195 and weighted average of 96.0%. Similarly, the statistical analysis conducted on geographies consisting of 357,852,634 people shows a significant negative correlation between the proportion of Immigrants from El Salvador and percentage of population with at least 9th grade education in the United States with a correlation coefficient (R) of -0.657 and weighted average of 89.0%, a difference of 7.9%.
9th Grade Correlation Summary
| Measurement | Immigrants from Canada | Immigrants from El Salvador |
| Minimum | 83.7% | 54.6% |
| Maximum | 100.0% | 95.9% |
| Range | 16.3% | 41.3% |
| Mean | 96.9% | 84.1% |
| Median | 98.0% | 85.7% |
| Interquartile 25% (IQ1) | 96.9% | 81.5% |
| Interquartile 75% (IQ3) | 99.5% | 89.0% |
| Interquartile Range (IQR) | 2.6% | 7.5% |
| Standard Deviation (Sample) | 3.8% | 7.8% |
| Standard Deviation (Population) | 3.7% | 7.7% |
Similar Demographics by 9th Grade
Demographics Similar to Immigrants from Canada by 9th Grade
In terms of 9th grade, the demographic groups most similar to Immigrants from Canada are Austrian (96.0%, a difference of 0.010%), Immigrants from Austria (96.0%, a difference of 0.010%), Serbian (96.0%, a difference of 0.020%), Immigrants from North America (96.0%, a difference of 0.020%), and Immigrants from Northern Europe (96.0%, a difference of 0.030%).
| Demographics | Rating | Rank | 9th Grade |
| Russians | 99.9 /100 | #47 | Exceptional 96.0% |
| Australians | 99.9 /100 | #48 | Exceptional 96.0% |
| Greeks | 99.9 /100 | #49 | Exceptional 96.0% |
| Celtics | 99.9 /100 | #50 | Exceptional 96.0% |
| Immigrants | Northern Europe | 99.9 /100 | #51 | Exceptional 96.0% |
| Serbians | 99.9 /100 | #52 | Exceptional 96.0% |
| Austrians | 99.8 /100 | #53 | Exceptional 96.0% |
| Immigrants | Canada | 99.8 /100 | #54 | Exceptional 96.0% |
| Immigrants | Austria | 99.8 /100 | #55 | Exceptional 96.0% |
| Immigrants | North America | 99.8 /100 | #56 | Exceptional 96.0% |
| Macedonians | 99.8 /100 | #57 | Exceptional 96.0% |
| Aleuts | 99.8 /100 | #58 | Exceptional 96.0% |
| New Zealanders | 99.8 /100 | #59 | Exceptional 95.9% |
| Native Hawaiians | 99.8 /100 | #60 | Exceptional 95.9% |
| Sioux | 99.8 /100 | #61 | Exceptional 95.9% |
Demographics Similar to Immigrants from El Salvador by 9th Grade
In terms of 9th grade, the demographic groups most similar to Immigrants from El Salvador are Immigrants from Central America (89.0%, a difference of 0.020%), Immigrants from Mexico (88.7%, a difference of 0.36%), Immigrants from Guatemala (89.4%, a difference of 0.51%), Salvadoran (89.6%, a difference of 0.71%), and Spanish American Indian (88.3%, a difference of 0.79%).
| Demographics | Rating | Rank | 9th Grade |
| Immigrants | Yemen | 0.0 /100 | #333 | Tragic 90.8% |
| Immigrants | Azores | 0.0 /100 | #334 | Tragic 90.8% |
| Immigrants | Honduras | 0.0 /100 | #335 | Tragic 90.6% |
| Immigrants | Dominican Republic | 0.0 /100 | #336 | Tragic 90.5% |
| Immigrants | Latin America | 0.0 /100 | #337 | Tragic 90.4% |
| Central Americans | 0.0 /100 | #338 | Tragic 90.4% |
| Yakama | 0.0 /100 | #339 | Tragic 90.1% |
| Mexicans | 0.0 /100 | #340 | Tragic 90.0% |
| Guatemalans | 0.0 /100 | #341 | Tragic 89.9% |
| Salvadorans | 0.0 /100 | #342 | Tragic 89.6% |
| Immigrants | Guatemala | 0.0 /100 | #343 | Tragic 89.4% |
| Immigrants | El Salvador | 0.0 /100 | #344 | Tragic 89.0% |
| Immigrants | Central America | 0.0 /100 | #345 | Tragic 89.0% |
| Immigrants | Mexico | 0.0 /100 | #346 | Tragic 88.7% |
| Spanish American Indians | 0.0 /100 | #347 | Tragic 88.3% |