Immigrants from Canada vs Immigrants from Saudi Arabia 3rd Grade
COMPARE
Immigrants from Canada
Immigrants from Saudi Arabia
3rd Grade
3rd Grade Comparison
Immigrants from Canada
Immigrants from Saudi Arabia
98.2%
3RD GRADE
99.7/ 100
METRIC RATING
62nd/ 347
METRIC RANK
98.0%
3RD GRADE
93.5/ 100
METRIC RATING
125th/ 347
METRIC RANK
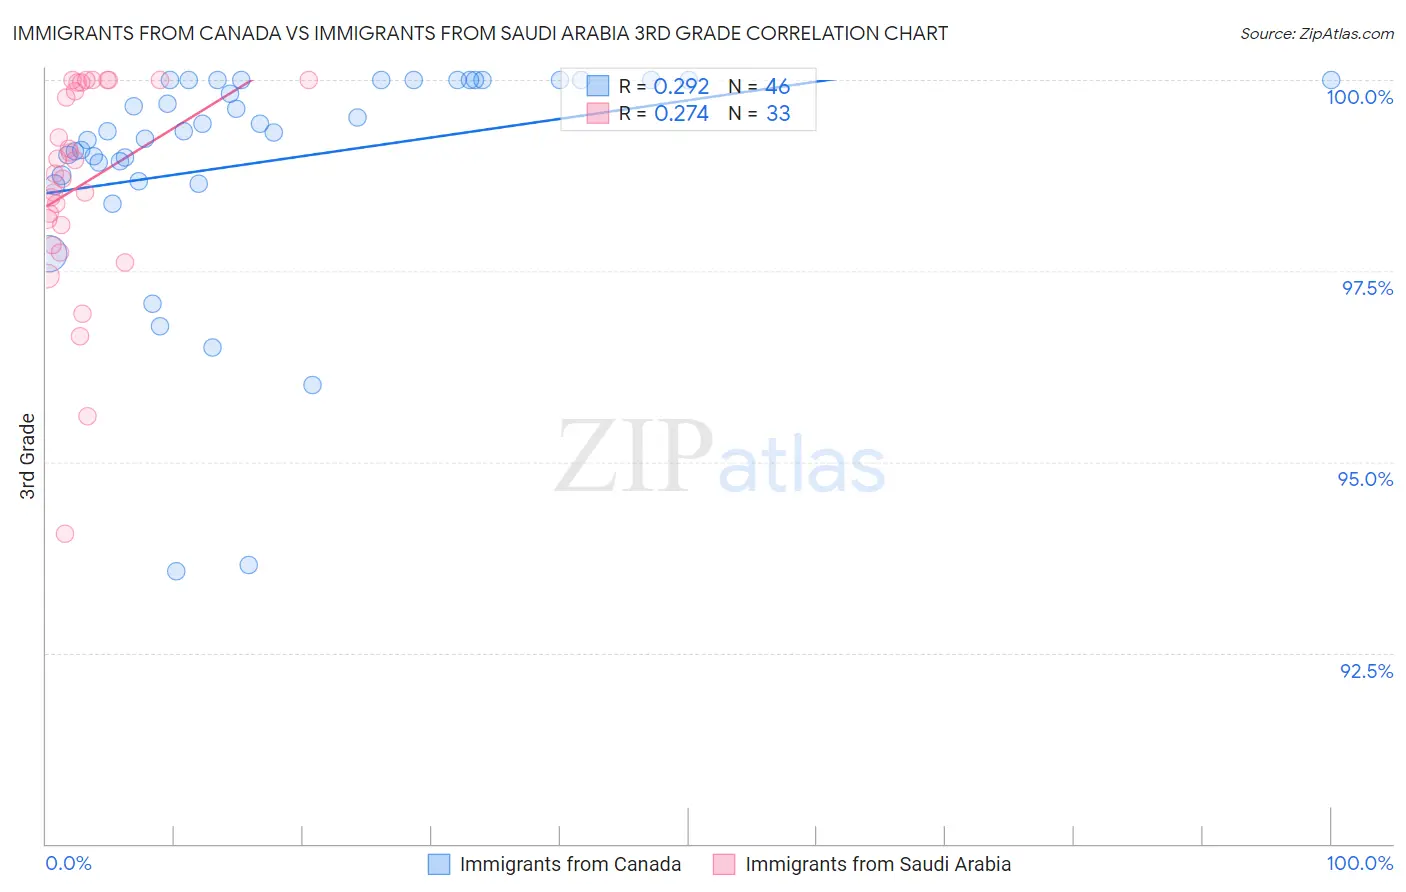
Immigrants from Canada vs Immigrants from Saudi Arabia 3rd Grade Correlation Chart
The statistical analysis conducted on geographies consisting of 459,397,554 people shows a weak positive correlation between the proportion of Immigrants from Canada and percentage of population with at least 3rd grade education in the United States with a correlation coefficient (R) of 0.292 and weighted average of 98.2%. Similarly, the statistical analysis conducted on geographies consisting of 164,277,573 people shows a weak positive correlation between the proportion of Immigrants from Saudi Arabia and percentage of population with at least 3rd grade education in the United States with a correlation coefficient (R) of 0.274 and weighted average of 98.0%, a difference of 0.27%.
3rd Grade Correlation Summary
| Measurement | Immigrants from Canada | Immigrants from Saudi Arabia |
| Minimum | 93.6% | 94.1% |
| Maximum | 100.0% | 100.0% |
| Range | 6.4% | 5.9% |
| Mean | 98.9% | 98.6% |
| Median | 99.3% | 98.8% |
| Interquartile 25% (IQ1) | 98.8% | 98.0% |
| Interquartile 75% (IQ3) | 100.0% | 100.0% |
| Interquartile Range (IQR) | 1.2% | 2.0% |
| Standard Deviation (Sample) | 1.5% | 1.4% |
| Standard Deviation (Population) | 1.5% | 1.4% |
Similar Demographics by 3rd Grade
Demographics Similar to Immigrants from Canada by 3rd Grade
In terms of 3rd grade, the demographic groups most similar to Immigrants from Canada are Pueblo (98.2%, a difference of 0.0%), Austrian (98.3%, a difference of 0.010%), Slavic (98.3%, a difference of 0.010%), Greek (98.3%, a difference of 0.010%), and Maltese (98.3%, a difference of 0.010%).
| Demographics | Rating | Rank | 3rd Grade |
| Americans | 99.8 /100 | #55 | Exceptional 98.3% |
| Austrians | 99.8 /100 | #56 | Exceptional 98.3% |
| Slavs | 99.7 /100 | #57 | Exceptional 98.3% |
| Greeks | 99.7 /100 | #58 | Exceptional 98.3% |
| Maltese | 99.7 /100 | #59 | Exceptional 98.3% |
| Creek | 99.7 /100 | #60 | Exceptional 98.2% |
| Pueblo | 99.7 /100 | #61 | Exceptional 98.2% |
| Immigrants | Canada | 99.7 /100 | #62 | Exceptional 98.2% |
| Immigrants | North America | 99.7 /100 | #63 | Exceptional 98.2% |
| Kiowa | 99.6 /100 | #64 | Exceptional 98.2% |
| New Zealanders | 99.6 /100 | #65 | Exceptional 98.2% |
| Serbians | 99.6 /100 | #66 | Exceptional 98.2% |
| Russians | 99.6 /100 | #67 | Exceptional 98.2% |
| Immigrants | Northern Europe | 99.6 /100 | #68 | Exceptional 98.2% |
| Canadians | 99.6 /100 | #69 | Exceptional 98.2% |
Demographics Similar to Immigrants from Saudi Arabia by 3rd Grade
In terms of 3rd grade, the demographic groups most similar to Immigrants from Saudi Arabia are Syrian (98.0%, a difference of 0.0%), Immigrants from Japan (98.0%, a difference of 0.0%), Immigrants from Zimbabwe (98.0%, a difference of 0.0%), Ute (98.0%, a difference of 0.0%), and Immigrants from Croatia (98.0%, a difference of 0.010%).
| Demographics | Rating | Rank | 3rd Grade |
| Iranians | 94.9 /100 | #118 | Exceptional 98.0% |
| Spanish | 94.8 /100 | #119 | Exceptional 98.0% |
| Immigrants | Croatia | 94.4 /100 | #120 | Exceptional 98.0% |
| Iroquois | 94.1 /100 | #121 | Exceptional 98.0% |
| Lebanese | 94.1 /100 | #122 | Exceptional 98.0% |
| Syrians | 93.8 /100 | #123 | Exceptional 98.0% |
| Immigrants | Japan | 93.7 /100 | #124 | Exceptional 98.0% |
| Immigrants | Saudi Arabia | 93.5 /100 | #125 | Exceptional 98.0% |
| Immigrants | Zimbabwe | 93.4 /100 | #126 | Exceptional 98.0% |
| Ute | 93.2 /100 | #127 | Exceptional 98.0% |
| Colville | 92.1 /100 | #128 | Exceptional 98.0% |
| Immigrants | Serbia | 91.9 /100 | #129 | Exceptional 98.0% |
| Immigrants | Europe | 91.2 /100 | #130 | Exceptional 98.0% |
| Immigrants | Bulgaria | 89.1 /100 | #131 | Excellent 97.9% |
| Immigrants | Hungary | 88.8 /100 | #132 | Excellent 97.9% |