Immigrants from Canada vs Shoshone 3rd Grade
COMPARE
Immigrants from Canada
Shoshone
3rd Grade
3rd Grade Comparison
Immigrants from Canada
Shoshone
98.2%
3RD GRADE
99.7/ 100
METRIC RATING
62nd/ 347
METRIC RANK
98.1%
3RD GRADE
99.0/ 100
METRIC RATING
82nd/ 347
METRIC RANK
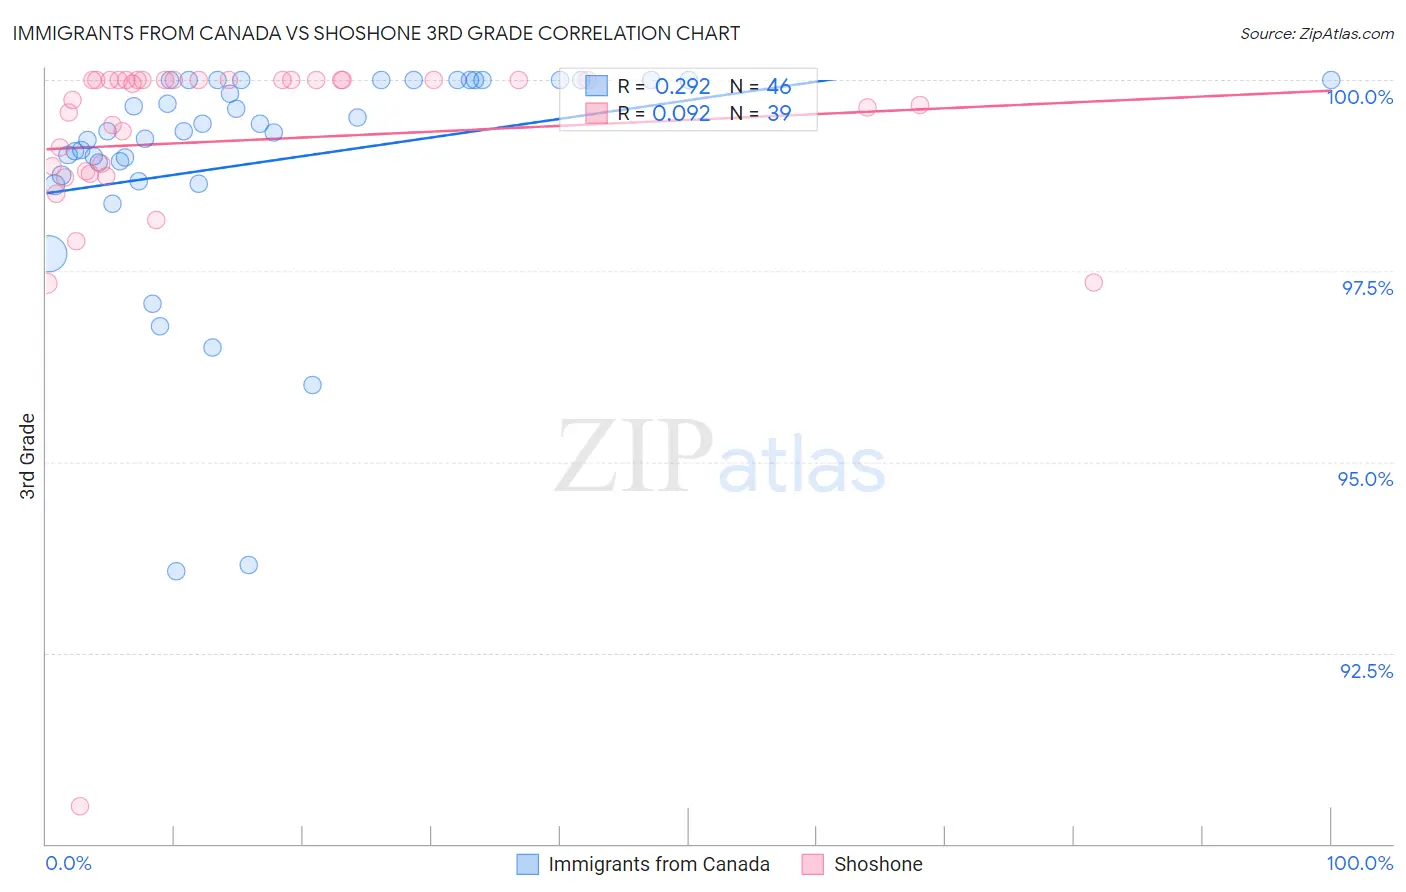
Immigrants from Canada vs Shoshone 3rd Grade Correlation Chart
The statistical analysis conducted on geographies consisting of 459,397,554 people shows a weak positive correlation between the proportion of Immigrants from Canada and percentage of population with at least 3rd grade education in the United States with a correlation coefficient (R) of 0.292 and weighted average of 98.2%. Similarly, the statistical analysis conducted on geographies consisting of 66,625,086 people shows a slight positive correlation between the proportion of Shoshone and percentage of population with at least 3rd grade education in the United States with a correlation coefficient (R) of 0.092 and weighted average of 98.1%, a difference of 0.10%.
3rd Grade Correlation Summary
| Measurement | Immigrants from Canada | Shoshone |
| Minimum | 93.6% | 90.5% |
| Maximum | 100.0% | 100.0% |
| Range | 6.4% | 9.5% |
| Mean | 98.9% | 99.2% |
| Median | 99.3% | 99.9% |
| Interquartile 25% (IQ1) | 98.8% | 98.8% |
| Interquartile 75% (IQ3) | 100.0% | 100.0% |
| Interquartile Range (IQR) | 1.2% | 1.2% |
| Standard Deviation (Sample) | 1.5% | 1.6% |
| Standard Deviation (Population) | 1.5% | 1.6% |
Demographics Similar to Immigrants from Canada and Shoshone by 3rd Grade
In terms of 3rd grade, the demographic groups most similar to Immigrants from Canada are Immigrants from North America (98.2%, a difference of 0.010%), Kiowa (98.2%, a difference of 0.020%), New Zealander (98.2%, a difference of 0.020%), Serbian (98.2%, a difference of 0.020%), and Russian (98.2%, a difference of 0.020%). Similarly, the demographic groups most similar to Shoshone are Icelander (98.1%, a difference of 0.0%), Osage (98.2%, a difference of 0.010%), Immigrants from Belgium (98.1%, a difference of 0.010%), Macedonian (98.1%, a difference of 0.010%), and Immigrants from England (98.2%, a difference of 0.020%).
| Demographics | Rating | Rank | 3rd Grade |
| Immigrants | Canada | 99.7 /100 | #62 | Exceptional 98.2% |
| Immigrants | North America | 99.7 /100 | #63 | Exceptional 98.2% |
| Kiowa | 99.6 /100 | #64 | Exceptional 98.2% |
| New Zealanders | 99.6 /100 | #65 | Exceptional 98.2% |
| Serbians | 99.6 /100 | #66 | Exceptional 98.2% |
| Russians | 99.6 /100 | #67 | Exceptional 98.2% |
| Immigrants | Northern Europe | 99.6 /100 | #68 | Exceptional 98.2% |
| Canadians | 99.6 /100 | #69 | Exceptional 98.2% |
| Cajuns | 99.6 /100 | #70 | Exceptional 98.2% |
| Immigrants | Austria | 99.6 /100 | #71 | Exceptional 98.2% |
| Chickasaw | 99.5 /100 | #72 | Exceptional 98.2% |
| Cheyenne | 99.3 /100 | #73 | Exceptional 98.2% |
| Immigrants | Netherlands | 99.3 /100 | #74 | Exceptional 98.2% |
| Cherokee | 99.3 /100 | #75 | Exceptional 98.2% |
| Immigrants | England | 99.2 /100 | #76 | Exceptional 98.2% |
| Immigrants | Lithuania | 99.2 /100 | #77 | Exceptional 98.2% |
| Osage | 99.2 /100 | #78 | Exceptional 98.2% |
| Immigrants | Belgium | 99.1 /100 | #79 | Exceptional 98.1% |
| Macedonians | 99.1 /100 | #80 | Exceptional 98.1% |
| Icelanders | 99.1 /100 | #81 | Exceptional 98.1% |
| Shoshone | 99.0 /100 | #82 | Exceptional 98.1% |