Osage vs Immigrants from Saudi Arabia 3rd Grade
COMPARE
Osage
Immigrants from Saudi Arabia
3rd Grade
3rd Grade Comparison
Osage
Immigrants from Saudi Arabia
98.2%
3RD GRADE
99.2/ 100
METRIC RATING
78th/ 347
METRIC RANK
98.0%
3RD GRADE
93.5/ 100
METRIC RATING
125th/ 347
METRIC RANK
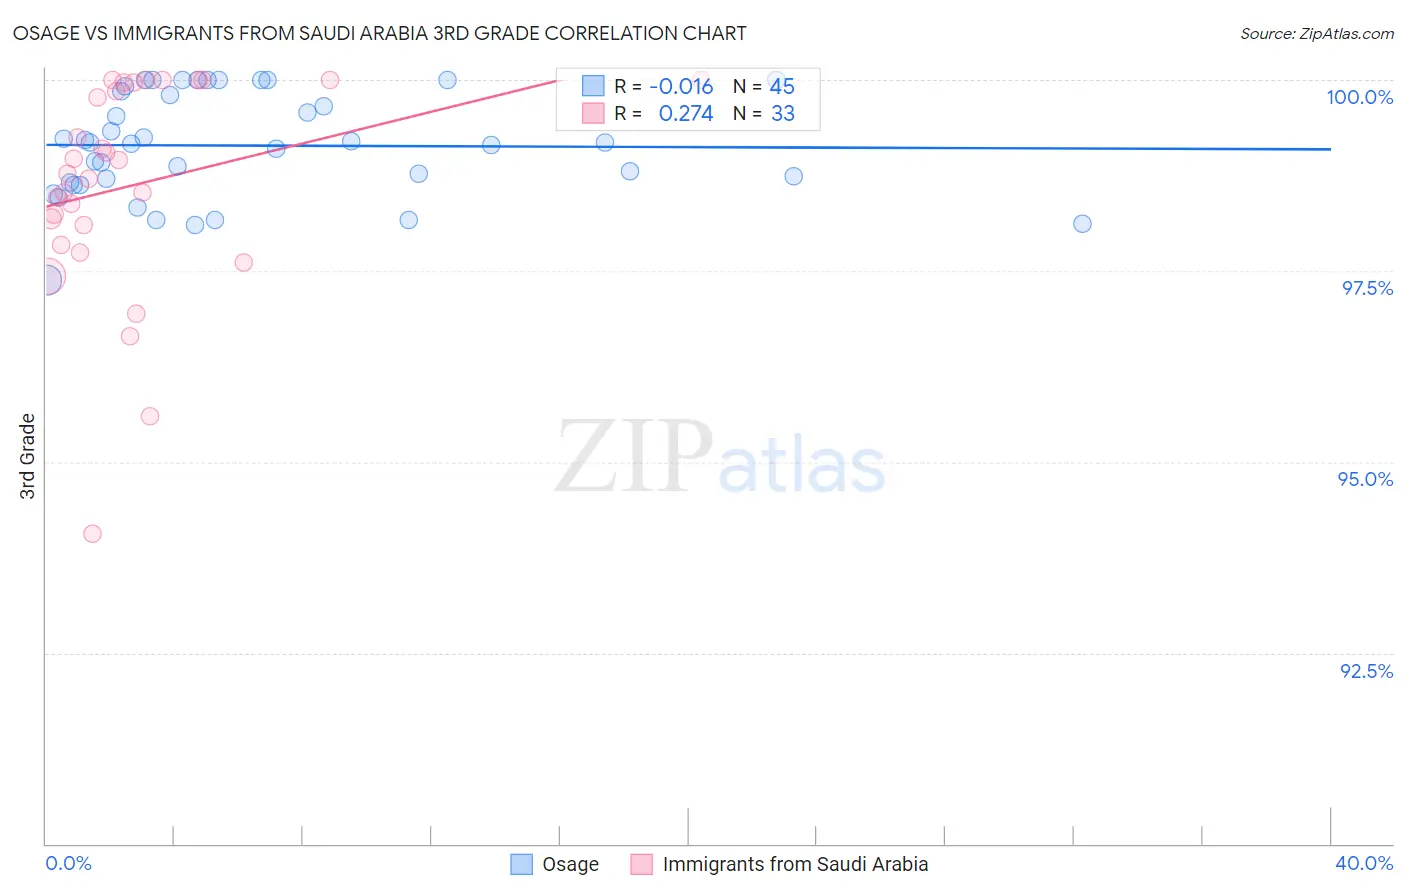
Osage vs Immigrants from Saudi Arabia 3rd Grade Correlation Chart
The statistical analysis conducted on geographies consisting of 91,808,929 people shows no correlation between the proportion of Osage and percentage of population with at least 3rd grade education in the United States with a correlation coefficient (R) of -0.016 and weighted average of 98.2%. Similarly, the statistical analysis conducted on geographies consisting of 164,277,573 people shows a weak positive correlation between the proportion of Immigrants from Saudi Arabia and percentage of population with at least 3rd grade education in the United States with a correlation coefficient (R) of 0.274 and weighted average of 98.0%, a difference of 0.18%.
3rd Grade Correlation Summary
| Measurement | Osage | Immigrants from Saudi Arabia |
| Minimum | 97.4% | 94.1% |
| Maximum | 100.0% | 100.0% |
| Range | 2.6% | 5.9% |
| Mean | 99.1% | 98.6% |
| Median | 99.2% | 98.8% |
| Interquartile 25% (IQ1) | 98.6% | 98.0% |
| Interquartile 75% (IQ3) | 99.9% | 100.0% |
| Interquartile Range (IQR) | 1.2% | 2.0% |
| Standard Deviation (Sample) | 0.69% | 1.4% |
| Standard Deviation (Population) | 0.68% | 1.4% |
Similar Demographics by 3rd Grade
Demographics Similar to Osage by 3rd Grade
In terms of 3rd grade, the demographic groups most similar to Osage are Immigrants from Netherlands (98.2%, a difference of 0.010%), Cherokee (98.2%, a difference of 0.010%), Immigrants from England (98.2%, a difference of 0.010%), Immigrants from Lithuania (98.2%, a difference of 0.010%), and Immigrants from Belgium (98.1%, a difference of 0.010%).
| Demographics | Rating | Rank | 3rd Grade |
| Immigrants | Austria | 99.6 /100 | #71 | Exceptional 98.2% |
| Chickasaw | 99.5 /100 | #72 | Exceptional 98.2% |
| Cheyenne | 99.3 /100 | #73 | Exceptional 98.2% |
| Immigrants | Netherlands | 99.3 /100 | #74 | Exceptional 98.2% |
| Cherokee | 99.3 /100 | #75 | Exceptional 98.2% |
| Immigrants | England | 99.2 /100 | #76 | Exceptional 98.2% |
| Immigrants | Lithuania | 99.2 /100 | #77 | Exceptional 98.2% |
| Osage | 99.2 /100 | #78 | Exceptional 98.2% |
| Immigrants | Belgium | 99.1 /100 | #79 | Exceptional 98.1% |
| Macedonians | 99.1 /100 | #80 | Exceptional 98.1% |
| Icelanders | 99.1 /100 | #81 | Exceptional 98.1% |
| Shoshone | 99.0 /100 | #82 | Exceptional 98.1% |
| Ukrainians | 98.9 /100 | #83 | Exceptional 98.1% |
| Immigrants | Sweden | 98.9 /100 | #84 | Exceptional 98.1% |
| Immigrants | Australia | 98.9 /100 | #85 | Exceptional 98.1% |
Demographics Similar to Immigrants from Saudi Arabia by 3rd Grade
In terms of 3rd grade, the demographic groups most similar to Immigrants from Saudi Arabia are Syrian (98.0%, a difference of 0.0%), Immigrants from Japan (98.0%, a difference of 0.0%), Immigrants from Zimbabwe (98.0%, a difference of 0.0%), Ute (98.0%, a difference of 0.0%), and Immigrants from Croatia (98.0%, a difference of 0.010%).
| Demographics | Rating | Rank | 3rd Grade |
| Iranians | 94.9 /100 | #118 | Exceptional 98.0% |
| Spanish | 94.8 /100 | #119 | Exceptional 98.0% |
| Immigrants | Croatia | 94.4 /100 | #120 | Exceptional 98.0% |
| Iroquois | 94.1 /100 | #121 | Exceptional 98.0% |
| Lebanese | 94.1 /100 | #122 | Exceptional 98.0% |
| Syrians | 93.8 /100 | #123 | Exceptional 98.0% |
| Immigrants | Japan | 93.7 /100 | #124 | Exceptional 98.0% |
| Immigrants | Saudi Arabia | 93.5 /100 | #125 | Exceptional 98.0% |
| Immigrants | Zimbabwe | 93.4 /100 | #126 | Exceptional 98.0% |
| Ute | 93.2 /100 | #127 | Exceptional 98.0% |
| Colville | 92.1 /100 | #128 | Exceptional 98.0% |
| Immigrants | Serbia | 91.9 /100 | #129 | Exceptional 98.0% |
| Immigrants | Europe | 91.2 /100 | #130 | Exceptional 98.0% |
| Immigrants | Bulgaria | 89.1 /100 | #131 | Excellent 97.9% |
| Immigrants | Hungary | 88.8 /100 | #132 | Excellent 97.9% |