Immigrants from Cameroon vs Immigrants from England College, Under 1 year
COMPARE
Immigrants from Cameroon
Immigrants from England
College, Under 1 year
College, Under 1 year Comparison
Immigrants from Cameroon
Immigrants from England
64.6%
COLLEGE, UNDER 1 YEAR
24.6/ 100
METRIC RATING
194th/ 347
METRIC RANK
68.7%
COLLEGE, UNDER 1 YEAR
99.0/ 100
METRIC RATING
73rd/ 347
METRIC RANK
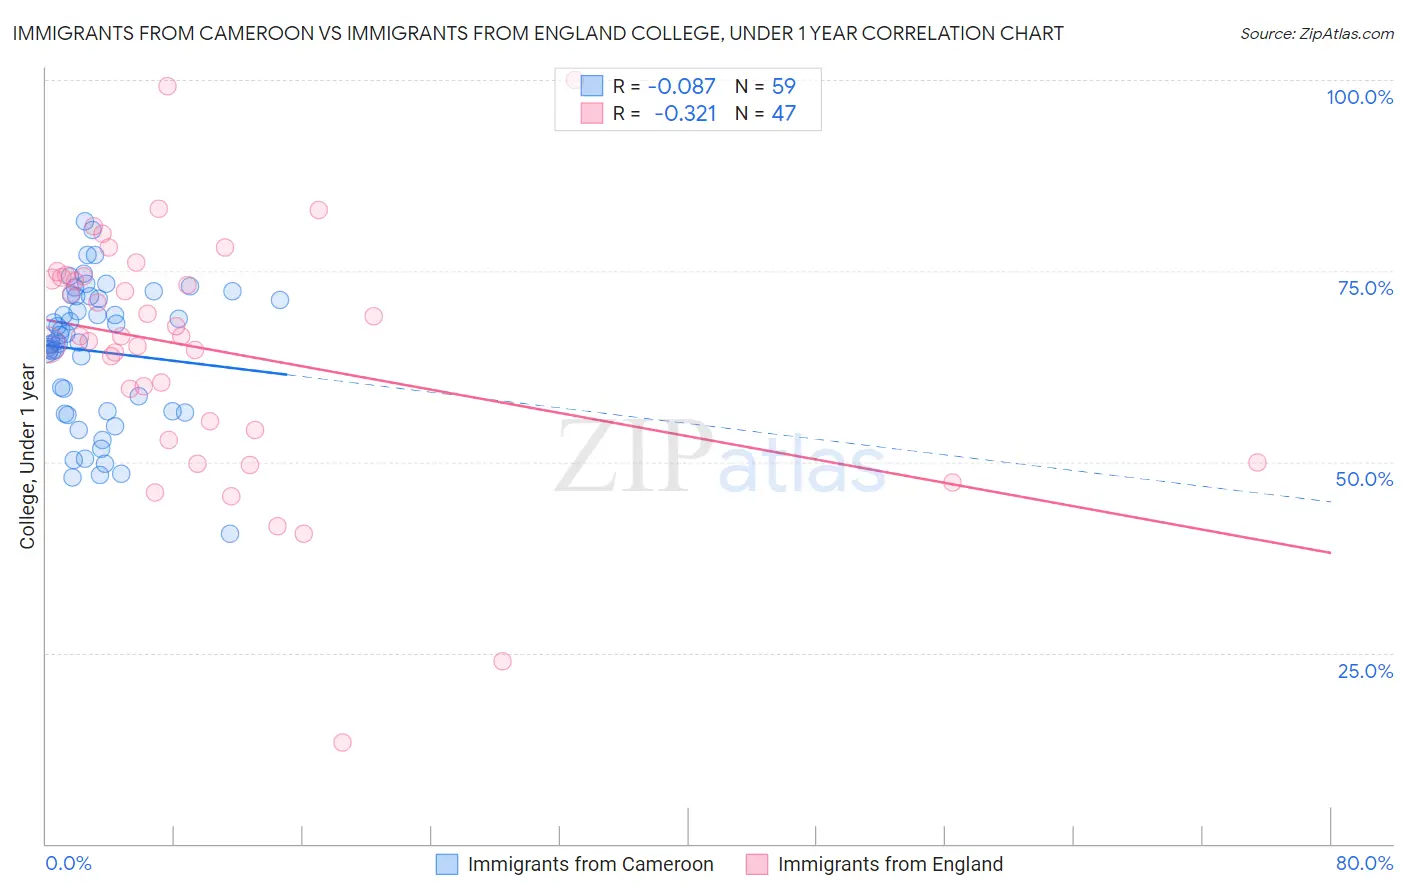
Immigrants from Cameroon vs Immigrants from England College, Under 1 year Correlation Chart
The statistical analysis conducted on geographies consisting of 130,767,721 people shows a slight negative correlation between the proportion of Immigrants from Cameroon and percentage of population with at least college, under 1 year education in the United States with a correlation coefficient (R) of -0.087 and weighted average of 64.6%. Similarly, the statistical analysis conducted on geographies consisting of 391,896,166 people shows a mild negative correlation between the proportion of Immigrants from England and percentage of population with at least college, under 1 year education in the United States with a correlation coefficient (R) of -0.321 and weighted average of 68.7%, a difference of 6.4%.
College, Under 1 year Correlation Summary
| Measurement | Immigrants from Cameroon | Immigrants from England |
| Minimum | 40.6% | 13.3% |
| Maximum | 81.6% | 100.0% |
| Range | 41.0% | 86.7% |
| Mean | 64.5% | 64.6% |
| Median | 65.7% | 66.4% |
| Interquartile 25% (IQ1) | 56.5% | 54.1% |
| Interquartile 75% (IQ3) | 71.7% | 74.3% |
| Interquartile Range (IQR) | 15.2% | 20.2% |
| Standard Deviation (Sample) | 9.1% | 16.4% |
| Standard Deviation (Population) | 9.0% | 16.3% |
Similar Demographics by College, Under 1 year
Demographics Similar to Immigrants from Cameroon by College, Under 1 year
In terms of college, under 1 year, the demographic groups most similar to Immigrants from Cameroon are Slovak (64.7%, a difference of 0.13%), Immigrants from Thailand (64.7%, a difference of 0.14%), Immigrants from South Eastern Asia (64.5%, a difference of 0.16%), Immigrants from Armenia (64.7%, a difference of 0.20%), and Tongan (64.5%, a difference of 0.21%).
| Demographics | Rating | Rank | College, Under 1 year |
| Immigrants | Southern Europe | 34.3 /100 | #187 | Fair 64.9% |
| Immigrants | Albania | 32.0 /100 | #188 | Fair 64.9% |
| Spanish | 31.6 /100 | #189 | Fair 64.9% |
| Immigrants | Philippines | 30.1 /100 | #190 | Fair 64.8% |
| Immigrants | Armenia | 28.1 /100 | #191 | Fair 64.7% |
| Immigrants | Thailand | 27.0 /100 | #192 | Fair 64.7% |
| Slovaks | 26.7 /100 | #193 | Fair 64.7% |
| Immigrants | Cameroon | 24.6 /100 | #194 | Fair 64.6% |
| Immigrants | South Eastern Asia | 22.1 /100 | #195 | Fair 64.5% |
| Tongans | 21.2 /100 | #196 | Fair 64.5% |
| Costa Ricans | 19.6 /100 | #197 | Poor 64.4% |
| Tsimshian | 17.9 /100 | #198 | Poor 64.3% |
| Panamanians | 17.0 /100 | #199 | Poor 64.3% |
| Nigerians | 16.7 /100 | #200 | Poor 64.3% |
| French Canadians | 16.3 /100 | #201 | Poor 64.2% |
Demographics Similar to Immigrants from England by College, Under 1 year
In terms of college, under 1 year, the demographic groups most similar to Immigrants from England are Bolivian (68.7%, a difference of 0.040%), Swedish (68.7%, a difference of 0.060%), Immigrants from Europe (68.8%, a difference of 0.080%), Lithuanian (68.8%, a difference of 0.090%), and Immigrants from Romania (68.9%, a difference of 0.26%).
| Demographics | Rating | Rank | College, Under 1 year |
| Immigrants | North America | 99.3 /100 | #66 | Exceptional 69.0% |
| Immigrants | Zimbabwe | 99.2 /100 | #67 | Exceptional 68.9% |
| Immigrants | Indonesia | 99.2 /100 | #68 | Exceptional 68.9% |
| Immigrants | Romania | 99.2 /100 | #69 | Exceptional 68.9% |
| Lithuanians | 99.1 /100 | #70 | Exceptional 68.8% |
| Immigrants | Europe | 99.1 /100 | #71 | Exceptional 68.8% |
| Bolivians | 99.0 /100 | #72 | Exceptional 68.7% |
| Immigrants | England | 99.0 /100 | #73 | Exceptional 68.7% |
| Swedes | 98.9 /100 | #74 | Exceptional 68.7% |
| Immigrants | Western Europe | 98.6 /100 | #75 | Exceptional 68.5% |
| Laotians | 98.6 /100 | #76 | Exceptional 68.5% |
| British | 98.6 /100 | #77 | Exceptional 68.5% |
| Danes | 98.6 /100 | #78 | Exceptional 68.5% |
| Greeks | 98.6 /100 | #79 | Exceptional 68.5% |
| Immigrants | Spain | 98.5 /100 | #80 | Exceptional 68.4% |