Immigrants from Cameroon vs Immigrants from Sudan Kindergarten
COMPARE
Immigrants from Cameroon
Immigrants from Sudan
Kindergarten
Kindergarten Comparison
Immigrants from Cameroon
Immigrants from Sudan
97.4%
KINDERGARTEN
0.1/ 100
METRIC RATING
274th/ 347
METRIC RANK
97.7%
KINDERGARTEN
4.5/ 100
METRIC RATING
222nd/ 347
METRIC RANK
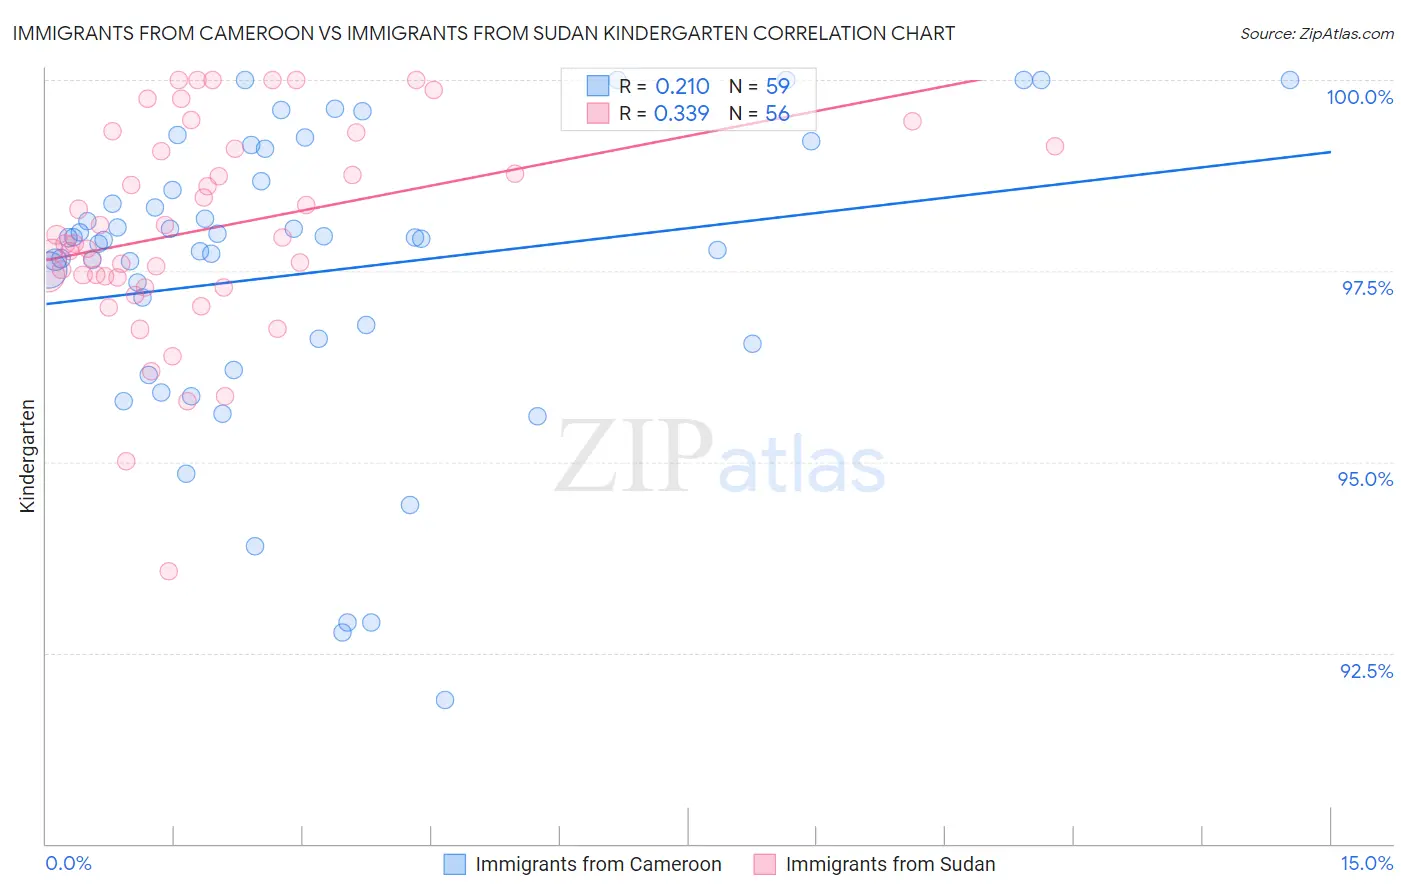
Immigrants from Cameroon vs Immigrants from Sudan Kindergarten Correlation Chart
The statistical analysis conducted on geographies consisting of 130,769,742 people shows a weak positive correlation between the proportion of Immigrants from Cameroon and percentage of population with at least kindergarten education in the United States with a correlation coefficient (R) of 0.210 and weighted average of 97.4%. Similarly, the statistical analysis conducted on geographies consisting of 118,957,985 people shows a mild positive correlation between the proportion of Immigrants from Sudan and percentage of population with at least kindergarten education in the United States with a correlation coefficient (R) of 0.339 and weighted average of 97.7%, a difference of 0.29%.
Kindergarten Correlation Summary
| Measurement | Immigrants from Cameroon | Immigrants from Sudan |
| Minimum | 91.9% | 93.6% |
| Maximum | 100.0% | 100.0% |
| Range | 8.1% | 6.4% |
| Mean | 97.5% | 98.1% |
| Median | 97.9% | 97.9% |
| Interquartile 25% (IQ1) | 96.5% | 97.4% |
| Interquartile 75% (IQ3) | 98.7% | 99.1% |
| Interquartile Range (IQR) | 2.1% | 1.7% |
| Standard Deviation (Sample) | 1.9% | 1.4% |
| Standard Deviation (Population) | 1.9% | 1.3% |
Similar Demographics by Kindergarten
Demographics Similar to Immigrants from Cameroon by Kindergarten
In terms of kindergarten, the demographic groups most similar to Immigrants from Cameroon are Immigrants from China (97.4%, a difference of 0.0%), Ghanaian (97.4%, a difference of 0.0%), Immigrants from Philippines (97.4%, a difference of 0.020%), Immigrants from Peru (97.5%, a difference of 0.030%), and Immigrants from Bolivia (97.5%, a difference of 0.030%).
| Demographics | Rating | Rank | Kindergarten |
| Immigrants | Liberia | 0.3 /100 | #267 | Tragic 97.5% |
| Immigrants | Nigeria | 0.3 /100 | #268 | Tragic 97.5% |
| West Indians | 0.3 /100 | #269 | Tragic 97.5% |
| Immigrants | Jamaica | 0.2 /100 | #270 | Tragic 97.5% |
| Immigrants | Peru | 0.2 /100 | #271 | Tragic 97.5% |
| Immigrants | Bolivia | 0.2 /100 | #272 | Tragic 97.5% |
| Immigrants | China | 0.1 /100 | #273 | Tragic 97.4% |
| Immigrants | Cameroon | 0.1 /100 | #274 | Tragic 97.4% |
| Ghanaians | 0.1 /100 | #275 | Tragic 97.4% |
| Immigrants | Philippines | 0.1 /100 | #276 | Tragic 97.4% |
| Immigrants | Western Africa | 0.1 /100 | #277 | Tragic 97.4% |
| Immigrants | Uzbekistan | 0.1 /100 | #278 | Tragic 97.4% |
| Immigrants | Ghana | 0.1 /100 | #279 | Tragic 97.4% |
| Barbadians | 0.1 /100 | #280 | Tragic 97.4% |
| Trinidadians and Tobagonians | 0.1 /100 | #281 | Tragic 97.4% |
Demographics Similar to Immigrants from Sudan by Kindergarten
In terms of kindergarten, the demographic groups most similar to Immigrants from Sudan are Tongan (97.7%, a difference of 0.0%), Immigrants from Zaire (97.7%, a difference of 0.0%), Immigrants from Syria (97.7%, a difference of 0.0%), Immigrants from Panama (97.7%, a difference of 0.010%), and Iraqi (97.7%, a difference of 0.010%).
| Demographics | Rating | Rank | Kindergarten |
| Immigrants | Bahamas | 7.4 /100 | #215 | Tragic 97.8% |
| Samoans | 6.9 /100 | #216 | Tragic 97.8% |
| Bahamians | 6.6 /100 | #217 | Tragic 97.8% |
| Immigrants | Morocco | 5.4 /100 | #218 | Tragic 97.7% |
| Immigrants | Panama | 5.0 /100 | #219 | Tragic 97.7% |
| Tongans | 4.8 /100 | #220 | Tragic 97.7% |
| Immigrants | Zaire | 4.5 /100 | #221 | Tragic 97.7% |
| Immigrants | Sudan | 4.5 /100 | #222 | Tragic 97.7% |
| Immigrants | Syria | 4.3 /100 | #223 | Tragic 97.7% |
| Iraqis | 3.9 /100 | #224 | Tragic 97.7% |
| Immigrants | Nepal | 3.8 /100 | #225 | Tragic 97.7% |
| Sudanese | 3.7 /100 | #226 | Tragic 97.7% |
| Immigrants | Costa Rica | 3.6 /100 | #227 | Tragic 97.7% |
| Sub-Saharan Africans | 3.5 /100 | #228 | Tragic 97.7% |
| Sierra Leoneans | 3.4 /100 | #229 | Tragic 97.7% |