Immigrants from Cameroon vs Immigrants from Sudan Disability Age 35 to 64

COMPARE

Immigrants from Cameroon
Race
Ancestry
AfghanAfricanAlaska NativeAlaskan AthabascanAlbanianAleutAlsatianAmericanApacheArabArapahoArgentineanArmenianAssyrian/Chaldean/SyriacAustralianAustrianBahamianBangladeshiBarbadianBasqueBelgianBelizeanBermudanBhutaneseBlackfeetBolivianBrazilianBritishBritish West IndianBulgarianBurmeseCajunCambodianCanadianCape VerdeanCarpatho RusynCelticCentral AmericanCentral American IndianCherokeeCheyenneChickasawChileanChineseChippewaChoctawColombianColvilleComancheCosta RicanCreeCreekCroatianCrowCubanCypriotCzechCzechoslovakianDanishDelawareDominicanDutchDutch West IndianEastern EuropeanEcuadorianEgyptianEnglishEstonianEthiopianEuropeanFijianFilipinoFinnishFrenchFrench American IndianFrench CanadianGermanGerman RussianGhanaianGreekGuamanian/ChamorroGuatemalanGuyaneseHaitianHmongHonduranHopiHoumaHungarianIcelanderIndian (Asian)IndonesianInupiatIranianIraqiIrishIroquoisIsraeliItalianJamaicanJapaneseJordanianKenyanKiowaKoreanLaotianLatvianLebaneseLiberianLithuanianLumbeeLuxembourgerMacedonianMalaysianMalteseMarshalleseMenomineeMexicanMexican American IndianMongolianMoroccanNative HawaiianNavajoNepaleseNew ZealanderNicaraguanNigerianNorthern EuropeanNorwegianOkinawanOsageOttawaPaiutePakistaniPalestinianPanamanianParaguayanPennsylvania GermanPeruvianPimaPolishPortuguesePotawatomiPuebloPuerto RicanPuget Sound SalishRomanianRussianSalvadoranSamoanScandinavianScotch-IrishScottishSeminoleSenegaleseSerbianShoshoneSierra LeoneanSiouxSlavicSlovakSloveneSomaliSouth AfricanSouth AmericanSouth American IndianSoviet UnionSpaniardSpanishSpanish AmericanSpanish American IndianSri LankanSubsaharan AfricanSudaneseSwedishSwissSyrianTaiwaneseThaiTlingit-HaidaTohono O'OdhamTonganTrinidadian and TobagonianTsimshianTurkishU.S. Virgin IslanderUgandanUkrainianUruguayanUteVenezuelanVietnameseWelshWest IndianYakamaYaquiYugoslavianYumanYup'ikZimbabwean
Immigration
NonimmigrantsImmigrantsAfghanistanAfricaAlbaniaArgentinaArmeniaAsiaAustraliaAustriaBahamasBangladeshBarbadosBelarusBelgiumBelizeBoliviaBosnia and HerzegovinaBrazilBulgariaBurma/MyanmarCabo VerdeCambodiaCameroonCanadaCaribbeanCentral AmericaChileChinaColombiaCongoCosta RicaCroatiaCubaCzechoslovakiaDenmarkDominicaDominican RepublicEastern AfricaEastern AsiaEastern EuropeEcuadorEgyptEl SalvadorEnglandEritreaEthiopiaEuropeFijiFranceGermanyGhanaGreeceGrenadaGuatemalaGuyanaHaitiHondurasHong KongHungaryIndiaIndonesiaIranIraqIrelandIsraelItalyJamaicaJapanJordanKazakhstanKenyaKoreaKuwaitLaosLatin AmericaLatviaLebanonLiberiaLithuaniaMalaysiaMexicoMicronesiaMiddle AfricaMoldovaMoroccoNepalNetherlandsNicaraguaNigeriaNorth AmericaNorth MacedoniaNorthern AfricaNorthern EuropeNorwayOceaniaPakistanPanamaPeruPhilippinesPolandPortugalRomaniaRussiaSaudi ArabiaScotlandSenegalSerbiaSierra LeoneSingaporeSomaliaSouth AfricaSouth AmericaSouth Central AsiaSouth Eastern AsiaSouthern EuropeSpainSri LankaSt. Vincent and the GrenadinesSwedenSwitzerlandSyriaTaiwanThailandTrinidad and TobagoTurkeyUgandaUkraineUruguayUzbekistanVenezuelaVietnamWest IndiesWestern AfricaWestern AsiaWestern EuropeYemenZaireZimbabweAzores
Immigrants from Sudan
Race
Ancestry
AfghanAfricanAlaska NativeAlaskan AthabascanAlbanianAleutAlsatianAmericanApacheArabArapahoArgentineanArmenianAssyrian/Chaldean/SyriacAustralianAustrianBahamianBangladeshiBarbadianBasqueBelgianBelizeanBermudanBhutaneseBlackfeetBolivianBrazilianBritishBritish West IndianBulgarianBurmeseCajunCambodianCanadianCape VerdeanCarpatho RusynCelticCentral AmericanCentral American IndianCherokeeCheyenneChickasawChileanChineseChippewaChoctawColombianColvilleComancheCosta RicanCreeCreekCroatianCrowCubanCypriotCzechCzechoslovakianDanishDelawareDominicanDutchDutch West IndianEastern EuropeanEcuadorianEgyptianEnglishEstonianEthiopianEuropeanFijianFilipinoFinnishFrenchFrench American IndianFrench CanadianGermanGerman RussianGhanaianGreekGuamanian/ChamorroGuatemalanGuyaneseHaitianHmongHonduranHopiHoumaHungarianIcelanderIndian (Asian)IndonesianInupiatIranianIraqiIrishIroquoisIsraeliItalianJamaicanJapaneseJordanianKenyanKiowaKoreanLaotianLatvianLebaneseLiberianLithuanianLumbeeLuxembourgerMacedonianMalaysianMalteseMarshalleseMenomineeMexicanMexican American IndianMongolianMoroccanNative HawaiianNavajoNepaleseNew ZealanderNicaraguanNigerianNorthern EuropeanNorwegianOkinawanOsageOttawaPaiutePakistaniPalestinianPanamanianParaguayanPennsylvania GermanPeruvianPimaPolishPortuguesePotawatomiPuebloPuerto RicanPuget Sound SalishRomanianRussianSalvadoranSamoanScandinavianScotch-IrishScottishSeminoleSenegaleseSerbianShoshoneSierra LeoneanSiouxSlavicSlovakSloveneSomaliSouth AfricanSouth AmericanSouth American IndianSoviet UnionSpaniardSpanishSpanish AmericanSpanish American IndianSri LankanSubsaharan AfricanSudaneseSwedishSwissSyrianTaiwaneseThaiTlingit-HaidaTohono O'OdhamTonganTrinidadian and TobagonianTsimshianTurkishU.S. Virgin IslanderUgandanUkrainianUruguayanUteVenezuelanVietnameseWelshWest IndianYakamaYaquiYugoslavianYumanYup'ikZimbabwean
Immigration
NonimmigrantsImmigrantsAfghanistanAfricaAlbaniaArgentinaArmeniaAsiaAustraliaAustriaBahamasBangladeshBarbadosBelarusBelgiumBelizeBoliviaBosnia and HerzegovinaBrazilBulgariaBurma/MyanmarCabo VerdeCambodiaCanadaCaribbeanCentral AmericaChileChinaColombiaCongoCosta RicaCroatiaCubaCzechoslovakiaDenmarkDominicaDominican RepublicEastern AfricaEastern AsiaEastern EuropeEcuadorEgyptEl SalvadorEnglandEritreaEthiopiaEuropeFijiFranceGermanyGhanaGreeceGrenadaGuatemalaGuyanaHaitiHondurasHong KongHungaryIndiaIndonesiaIranIraqIrelandIsraelItalyJamaicaJapanJordanKazakhstanKenyaKoreaKuwaitLaosLatin AmericaLatviaLebanonLiberiaLithuaniaMalaysiaMexicoMicronesiaMiddle AfricaMoldovaMoroccoNepalNetherlandsNicaraguaNigeriaNorth AmericaNorth MacedoniaNorthern AfricaNorthern EuropeNorwayOceaniaPakistanPanamaPeruPhilippinesPolandPortugalRomaniaRussiaSaudi ArabiaScotlandSenegalSerbiaSierra LeoneSingaporeSomaliaSouth AfricaSouth AmericaSouth Central AsiaSouth Eastern AsiaSouthern EuropeSpainSri LankaSt. Vincent and the GrenadinesSudanSwedenSwitzerlandSyriaTaiwanThailandTrinidad and TobagoTurkeyUgandaUkraineUruguayUzbekistanVenezuelaVietnamWest IndiesWestern AfricaWestern AsiaWestern EuropeYemenZaireZimbabweAzores
Disability Age 35 to 64
Income
Poverty
Unemployment
Labor Participation
Family Structure
Vehicle Availability
Education Level
Disability

Disability Age 35 to 64 Comparison

Immigrants from Cameroon

Immigrants from Sudan

Excellent
Poor
10.9%
DISABILITY AGE 35 TO 64
81.1/ 100
METRIC RATING
149th/ 347
METRIC RANK
11.7%
DISABILITY AGE 35 TO 64
11.4/ 100
METRIC RATING
214th/ 347
METRIC RANK

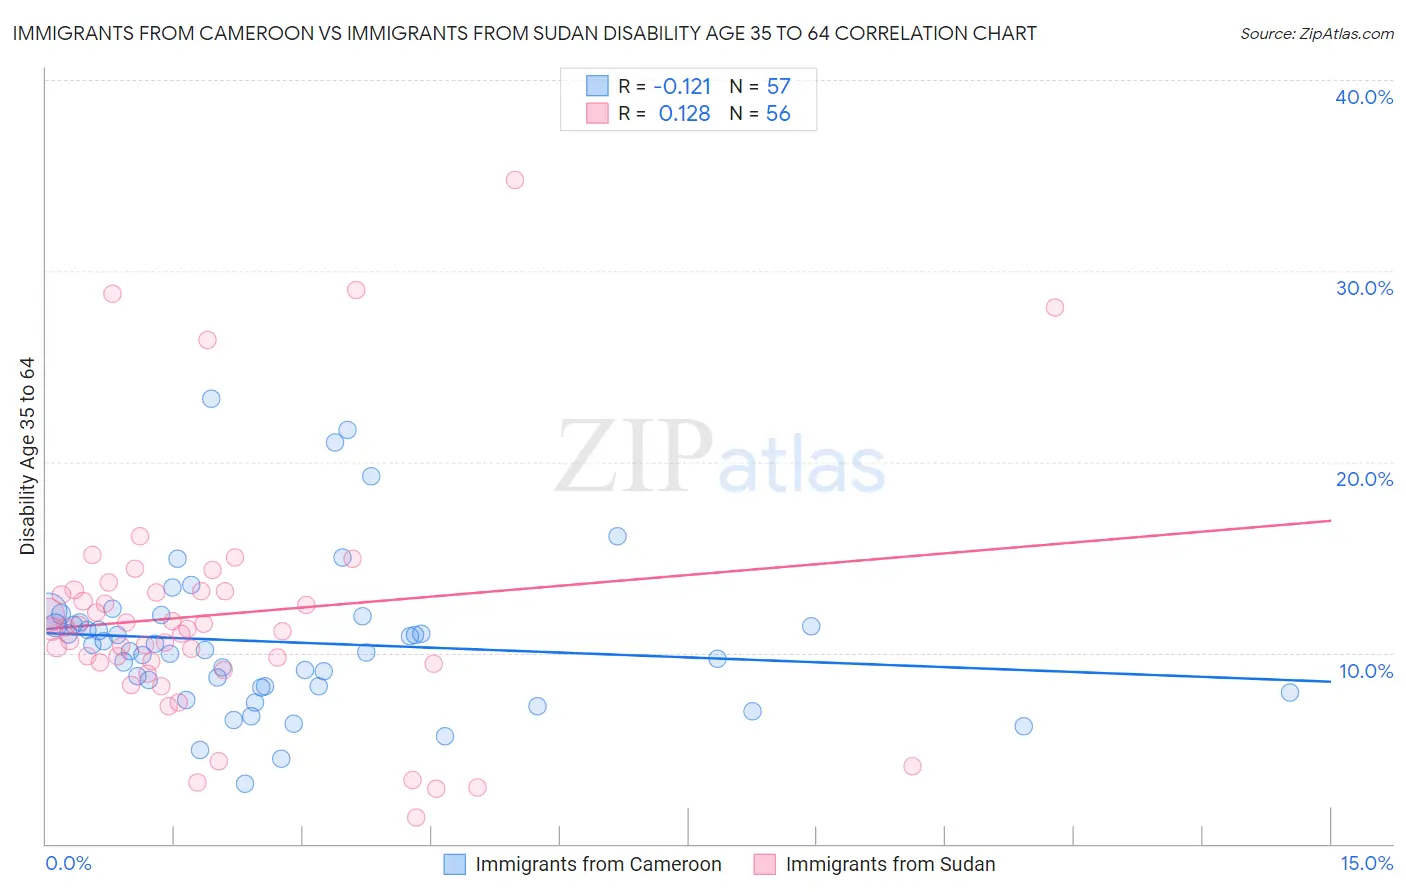
Immigrants from Cameroon vs Immigrants from Sudan Disability Age 35 to 64 Correlation Chart

The statistical analysis conducted on geographies consisting of 130,721,109 people shows a poor negative correlation between the proportion of Immigrants from Cameroon and percentage of population with a disability between the ages 34 and 64 in the United States with a correlation coefficient (R) of -0.121 and weighted average of 10.9%. Similarly, the statistical analysis conducted on geographies consisting of 118,946,104 people shows a poor positive correlation between the proportion of Immigrants from Sudan and percentage of population with a disability between the ages 34 and 64 in the United States with a correlation coefficient (R) of 0.128 and weighted average of 11.7%, a difference of 7.2%.
Immigrants from Cameroon vs Immigrants from Sudan Disability Age 35 to 64

Disability Age 35 to 64 Correlation Summary

MeasurementImmigrants from CameroonImmigrants from Sudan
Minimum3.2%1.4%
Maximum23.3%34.7%
Range20.2%33.4%
Mean10.5%12.0%
Median10.2%11.3%
Interquartile 25% (IQ1)8.2%9.5%
Interquartile 75% (IQ3)11.7%13.2%
Interquartile Range (IQR)3.5%3.7%
Standard Deviation (Sample)4.0%6.5%
Standard Deviation (Population)3.9%6.4%

Similar Demographics by Disability Age 35 to 64

Demographics Similar to Immigrants from Cameroon by Disability Age 35 to 64

In terms of disability age 35 to 64, the demographic groups most similar to Immigrants from Cameroon are Syrian (11.0%, a difference of 0.17%), Arab (10.9%, a difference of 0.22%), New Zealander (11.0%, a difference of 0.24%), Immigrants from Eritrea (10.9%, a difference of 0.32%), and South American Indian (10.9%, a difference of 0.34%).
DemographicsRating | RankDisability Age 35 to 64
Immigrants | Saudi Arabia
90.6
/100
|
#142
Exceptional
10.8%
Sierra Leoneans
89.7
/100
|
#143
Excellent
10.8%
Lithuanians
88.7
/100
|
#144
Excellent
10.8%
Immigrants | Bangladesh
85.6
/100
|
#145
Excellent
10.9%
South American Indians
83.5
/100
|
#146
Excellent
10.9%
Immigrants | Eritrea
83.4
/100
|
#147
Excellent
10.9%
Arabs
82.7
/100
|
#148
Excellent
10.9%
Immigrants | Cameroon
81.1
/100
|
#149
Excellent
10.9%
Syrians
79.8
/100
|
#150
Good
11.0%
New Zealanders
79.3
/100
|
#151
Good
11.0%
Ukrainians
78.0
/100
|
#152
Good
11.0%
Immigrants | England
77.4
/100
|
#153
Good
11.0%
Immigrants | Canada
76.7
/100
|
#154
Good
11.0%
Moroccans
76.4
/100
|
#155
Good
11.0%
Immigrants | Sierra Leone
76.2
/100
|
#156
Good
11.0%

Demographics Similar to Immigrants from Sudan by Disability Age 35 to 64

In terms of disability age 35 to 64, the demographic groups most similar to Immigrants from Sudan are Yugoslavian (11.7%, a difference of 0.030%), Spanish American Indian (11.7%, a difference of 0.050%), Immigrants from Jamaica (11.7%, a difference of 0.060%), Bahamian (11.8%, a difference of 0.14%), and Canadian (11.7%, a difference of 0.28%).
DemographicsRating | RankDisability Age 35 to 64
Ghanaians
14.8
/100
|
#207
Poor
11.7%
Guatemalans
14.6
/100
|
#208
Poor
11.7%
Europeans
13.5
/100
|
#209
Poor
11.7%
Belgians
13.1
/100
|
#210
Poor
11.7%
Canadians
13.0
/100
|
#211
Poor
11.7%
Immigrants | Jamaica
11.8
/100
|
#212
Poor
11.7%
Yugoslavians
11.6
/100
|
#213
Poor
11.7%
Immigrants | Sudan
11.4
/100
|
#214
Poor
11.7%
Spanish American Indians
11.1
/100
|
#215
Poor
11.7%
Bahamians
10.7
/100
|
#216
Poor
11.8%
Barbadians
9.5
/100
|
#217
Tragic
11.8%
Immigrants | Bahamas
9.2
/100
|
#218
Tragic
11.8%
Czechoslovakians
9.0
/100
|
#219
Tragic
11.8%
Immigrants | West Indies
8.9
/100
|
#220
Tragic
11.8%
Alsatians
8.5
/100
|
#221
Tragic
11.8%