Immigrants from Ethiopia vs Immigrants from Sudan Kindergarten
COMPARE
Immigrants from Ethiopia
Immigrants from Sudan
Kindergarten
Kindergarten Comparison
Immigrants from Ethiopia
Immigrants from Sudan
97.5%
KINDERGARTEN
0.4/ 100
METRIC RATING
262nd/ 347
METRIC RANK
97.7%
KINDERGARTEN
4.5/ 100
METRIC RATING
222nd/ 347
METRIC RANK
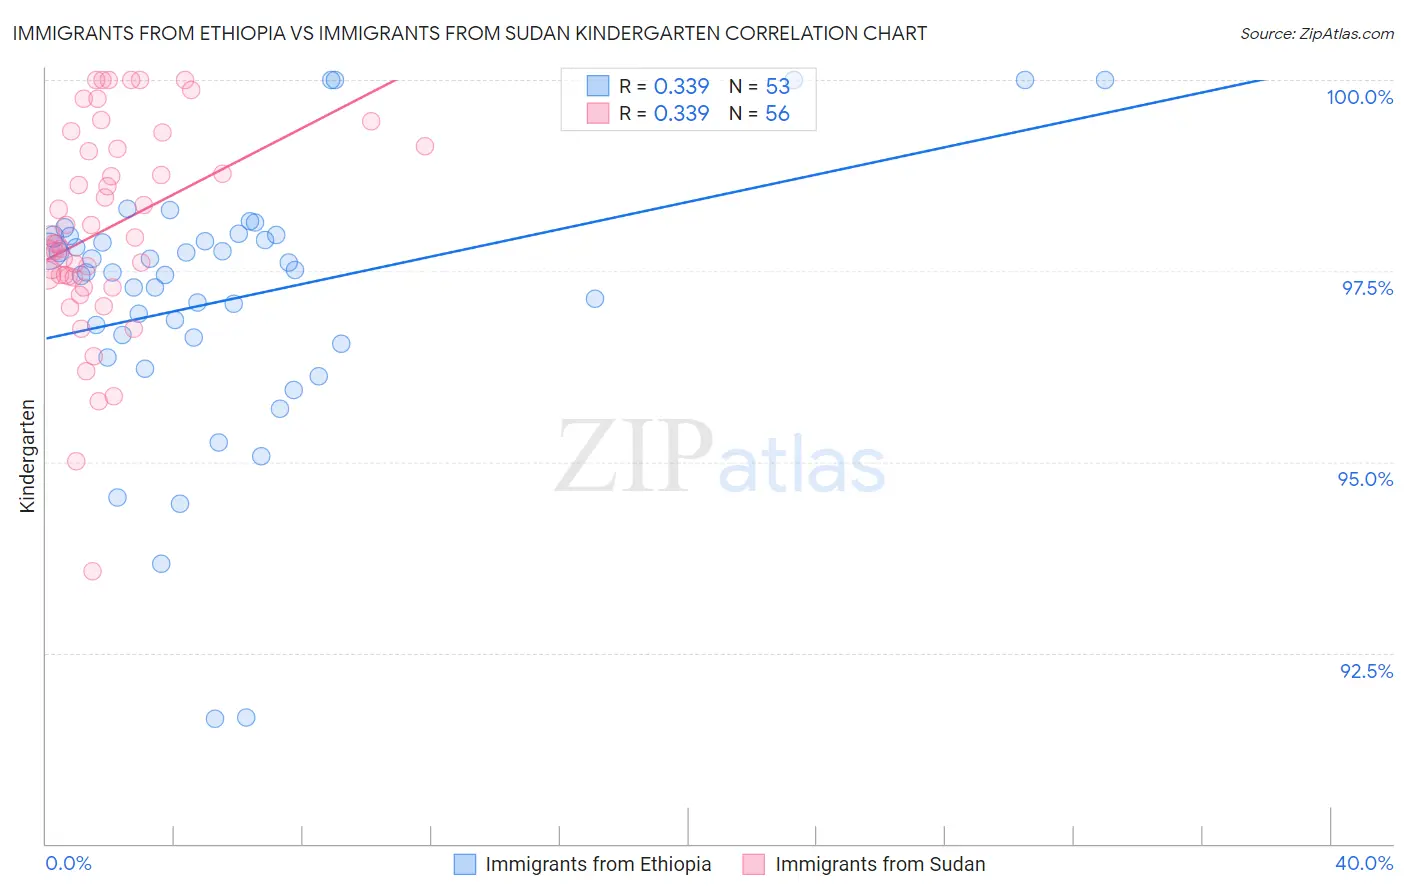
Immigrants from Ethiopia vs Immigrants from Sudan Kindergarten Correlation Chart
The statistical analysis conducted on geographies consisting of 211,539,400 people shows a mild positive correlation between the proportion of Immigrants from Ethiopia and percentage of population with at least kindergarten education in the United States with a correlation coefficient (R) of 0.339 and weighted average of 97.5%. Similarly, the statistical analysis conducted on geographies consisting of 118,957,985 people shows a mild positive correlation between the proportion of Immigrants from Sudan and percentage of population with at least kindergarten education in the United States with a correlation coefficient (R) of 0.339 and weighted average of 97.7%, a difference of 0.19%.
Kindergarten Correlation Summary
| Measurement | Immigrants from Ethiopia | Immigrants from Sudan |
| Minimum | 91.6% | 93.6% |
| Maximum | 100.0% | 100.0% |
| Range | 8.4% | 6.4% |
| Mean | 97.1% | 98.1% |
| Median | 97.5% | 97.9% |
| Interquartile 25% (IQ1) | 96.6% | 97.4% |
| Interquartile 75% (IQ3) | 98.0% | 99.1% |
| Interquartile Range (IQR) | 1.4% | 1.7% |
| Standard Deviation (Sample) | 1.7% | 1.4% |
| Standard Deviation (Population) | 1.7% | 1.3% |
Similar Demographics by Kindergarten
Demographics Similar to Immigrants from Ethiopia by Kindergarten
In terms of kindergarten, the demographic groups most similar to Immigrants from Ethiopia are Taiwanese (97.5%, a difference of 0.0%), Immigrants from South America (97.5%, a difference of 0.0%), Assyrian/Chaldean/Syriac (97.5%, a difference of 0.0%), Armenian (97.6%, a difference of 0.010%), and Fijian (97.5%, a difference of 0.010%).
| Demographics | Rating | Rank | Kindergarten |
| Immigrants | Congo | 0.8 /100 | #255 | Tragic 97.6% |
| Yaqui | 0.7 /100 | #256 | Tragic 97.6% |
| Immigrants | Colombia | 0.6 /100 | #257 | Tragic 97.6% |
| Jamaicans | 0.6 /100 | #258 | Tragic 97.6% |
| Armenians | 0.5 /100 | #259 | Tragic 97.6% |
| Fijians | 0.5 /100 | #260 | Tragic 97.5% |
| Taiwanese | 0.4 /100 | #261 | Tragic 97.5% |
| Immigrants | Ethiopia | 0.4 /100 | #262 | Tragic 97.5% |
| Immigrants | South America | 0.4 /100 | #263 | Tragic 97.5% |
| Assyrians/Chaldeans/Syriacs | 0.4 /100 | #264 | Tragic 97.5% |
| Cubans | 0.3 /100 | #265 | Tragic 97.5% |
| Immigrants | Sierra Leone | 0.3 /100 | #266 | Tragic 97.5% |
| Immigrants | Liberia | 0.3 /100 | #267 | Tragic 97.5% |
| Immigrants | Nigeria | 0.3 /100 | #268 | Tragic 97.5% |
| West Indians | 0.3 /100 | #269 | Tragic 97.5% |
Demographics Similar to Immigrants from Sudan by Kindergarten
In terms of kindergarten, the demographic groups most similar to Immigrants from Sudan are Tongan (97.7%, a difference of 0.0%), Immigrants from Zaire (97.7%, a difference of 0.0%), Immigrants from Syria (97.7%, a difference of 0.0%), Immigrants from Panama (97.7%, a difference of 0.010%), and Iraqi (97.7%, a difference of 0.010%).
| Demographics | Rating | Rank | Kindergarten |
| Immigrants | Bahamas | 7.4 /100 | #215 | Tragic 97.8% |
| Samoans | 6.9 /100 | #216 | Tragic 97.8% |
| Bahamians | 6.6 /100 | #217 | Tragic 97.8% |
| Immigrants | Morocco | 5.4 /100 | #218 | Tragic 97.7% |
| Immigrants | Panama | 5.0 /100 | #219 | Tragic 97.7% |
| Tongans | 4.8 /100 | #220 | Tragic 97.7% |
| Immigrants | Zaire | 4.5 /100 | #221 | Tragic 97.7% |
| Immigrants | Sudan | 4.5 /100 | #222 | Tragic 97.7% |
| Immigrants | Syria | 4.3 /100 | #223 | Tragic 97.7% |
| Iraqis | 3.9 /100 | #224 | Tragic 97.7% |
| Immigrants | Nepal | 3.8 /100 | #225 | Tragic 97.7% |
| Sudanese | 3.7 /100 | #226 | Tragic 97.7% |
| Immigrants | Costa Rica | 3.6 /100 | #227 | Tragic 97.7% |
| Sub-Saharan Africans | 3.5 /100 | #228 | Tragic 97.7% |
| Sierra Leoneans | 3.4 /100 | #229 | Tragic 97.7% |