Immigrants from Cambodia vs Cambodian 6th Grade
COMPARE
Immigrants from Cambodia
Cambodian
6th Grade
6th Grade Comparison
Immigrants from Cambodia
Cambodians
95.2%
6TH GRADE
0.0/ 100
METRIC RATING
322nd/ 347
METRIC RANK
97.3%
6TH GRADE
91.8/ 100
METRIC RATING
130th/ 347
METRIC RANK
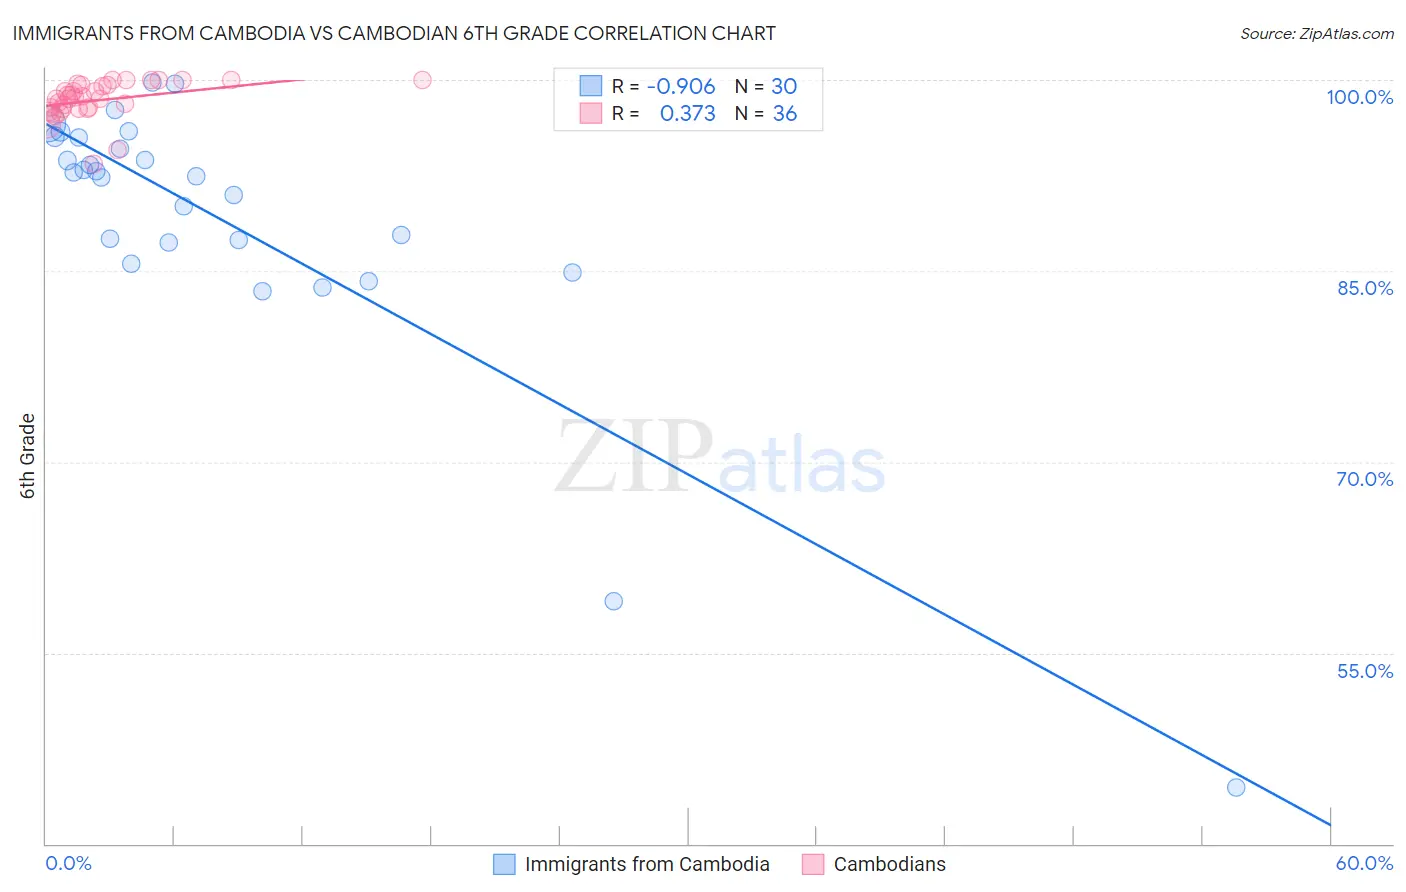
Immigrants from Cambodia vs Cambodian 6th Grade Correlation Chart
The statistical analysis conducted on geographies consisting of 205,153,442 people shows a near-perfect negative correlation between the proportion of Immigrants from Cambodia and percentage of population with at least 6th grade education in the United States with a correlation coefficient (R) of -0.906 and weighted average of 95.2%. Similarly, the statistical analysis conducted on geographies consisting of 102,511,743 people shows a mild positive correlation between the proportion of Cambodians and percentage of population with at least 6th grade education in the United States with a correlation coefficient (R) of 0.373 and weighted average of 97.3%, a difference of 2.3%.
6th Grade Correlation Summary
| Measurement | Immigrants from Cambodia | Cambodian |
| Minimum | 44.4% | 93.4% |
| Maximum | 99.8% | 100.0% |
| Range | 55.4% | 6.6% |
| Mean | 89.0% | 98.4% |
| Median | 92.6% | 98.5% |
| Interquartile 25% (IQ1) | 87.3% | 97.7% |
| Interquartile 75% (IQ3) | 95.4% | 99.6% |
| Interquartile Range (IQR) | 8.2% | 1.9% |
| Standard Deviation (Sample) | 11.3% | 1.5% |
| Standard Deviation (Population) | 11.1% | 1.5% |
Similar Demographics by 6th Grade
Demographics Similar to Immigrants from Cambodia by 6th Grade
In terms of 6th grade, the demographic groups most similar to Immigrants from Cambodia are Central American Indian (95.1%, a difference of 0.010%), Cape Verdean (95.1%, a difference of 0.040%), Immigrants from Fiji (95.2%, a difference of 0.050%), Immigrants from Nicaragua (95.1%, a difference of 0.070%), and Immigrants from Ecuador (95.3%, a difference of 0.12%).
| Demographics | Rating | Rank | 6th Grade |
| Immigrants | Bangladesh | 0.0 /100 | #315 | Tragic 95.4% |
| Japanese | 0.0 /100 | #316 | Tragic 95.4% |
| Vietnamese | 0.0 /100 | #317 | Tragic 95.3% |
| Belizeans | 0.0 /100 | #318 | Tragic 95.3% |
| Immigrants | Belize | 0.0 /100 | #319 | Tragic 95.3% |
| Immigrants | Ecuador | 0.0 /100 | #320 | Tragic 95.3% |
| Immigrants | Fiji | 0.0 /100 | #321 | Tragic 95.2% |
| Immigrants | Cambodia | 0.0 /100 | #322 | Tragic 95.2% |
| Central American Indians | 0.0 /100 | #323 | Tragic 95.1% |
| Cape Verdeans | 0.0 /100 | #324 | Tragic 95.1% |
| Immigrants | Nicaragua | 0.0 /100 | #325 | Tragic 95.1% |
| Hispanics or Latinos | 0.0 /100 | #326 | Tragic 95.0% |
| Mexican American Indians | 0.0 /100 | #327 | Tragic 95.0% |
| Hondurans | 0.0 /100 | #328 | Tragic 95.0% |
| Dominicans | 0.0 /100 | #329 | Tragic 94.9% |
Demographics Similar to Cambodians by 6th Grade
In terms of 6th grade, the demographic groups most similar to Cambodians are Immigrants from Romania (97.3%, a difference of 0.0%), Immigrants from Serbia (97.3%, a difference of 0.0%), Immigrants from Europe (97.3%, a difference of 0.010%), Palestinian (97.3%, a difference of 0.010%), and Immigrants from Croatia (97.3%, a difference of 0.020%).
| Demographics | Rating | Rank | 6th Grade |
| Hmong | 94.4 /100 | #123 | Exceptional 97.4% |
| Okinawans | 94.2 /100 | #124 | Exceptional 97.4% |
| Spanish | 93.7 /100 | #125 | Exceptional 97.3% |
| Immigrants | Bulgaria | 93.6 /100 | #126 | Exceptional 97.3% |
| Immigrants | Croatia | 93.1 /100 | #127 | Exceptional 97.3% |
| Immigrants | Romania | 92.0 /100 | #128 | Exceptional 97.3% |
| Immigrants | Serbia | 91.9 /100 | #129 | Exceptional 97.3% |
| Cambodians | 91.8 /100 | #130 | Exceptional 97.3% |
| Immigrants | Europe | 91.1 /100 | #131 | Exceptional 97.3% |
| Palestinians | 90.9 /100 | #132 | Exceptional 97.3% |
| Immigrants | Moldova | 90.0 /100 | #133 | Excellent 97.3% |
| Immigrants | Kuwait | 89.5 /100 | #134 | Excellent 97.3% |
| Immigrants | Hungary | 89.5 /100 | #135 | Excellent 97.3% |
| Filipinos | 88.9 /100 | #136 | Excellent 97.3% |
| Burmese | 87.8 /100 | #137 | Excellent 97.3% |