Immigrants from Iran vs Macedonian 3rd Grade
COMPARE
Immigrants from Iran
Macedonian
3rd Grade
3rd Grade Comparison
Immigrants from Iran
Macedonians
97.8%
3RD GRADE
59.1/ 100
METRIC RATING
160th/ 347
METRIC RANK
98.1%
3RD GRADE
99.1/ 100
METRIC RATING
80th/ 347
METRIC RANK
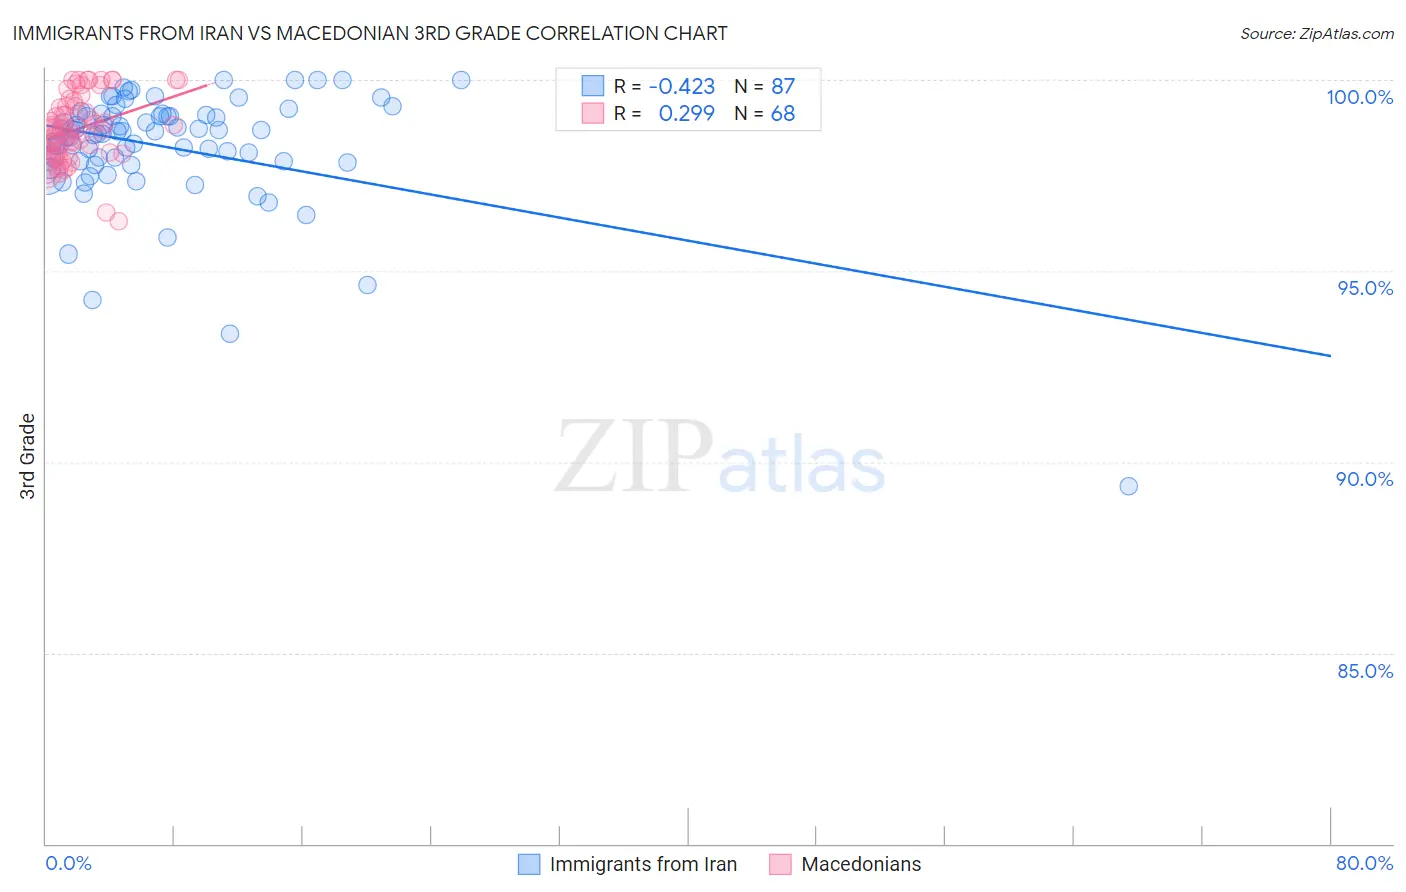
Immigrants from Iran vs Macedonian 3rd Grade Correlation Chart
The statistical analysis conducted on geographies consisting of 279,905,207 people shows a moderate negative correlation between the proportion of Immigrants from Iran and percentage of population with at least 3rd grade education in the United States with a correlation coefficient (R) of -0.423 and weighted average of 97.8%. Similarly, the statistical analysis conducted on geographies consisting of 132,592,860 people shows a weak positive correlation between the proportion of Macedonians and percentage of population with at least 3rd grade education in the United States with a correlation coefficient (R) of 0.299 and weighted average of 98.1%, a difference of 0.37%.
3rd Grade Correlation Summary
| Measurement | Immigrants from Iran | Macedonian |
| Minimum | 89.4% | 96.3% |
| Maximum | 100.0% | 100.0% |
| Range | 10.6% | 3.7% |
| Mean | 98.3% | 98.7% |
| Median | 98.6% | 98.7% |
| Interquartile 25% (IQ1) | 97.9% | 98.1% |
| Interquartile 75% (IQ3) | 99.1% | 99.3% |
| Interquartile Range (IQR) | 1.2% | 1.2% |
| Standard Deviation (Sample) | 1.6% | 0.86% |
| Standard Deviation (Population) | 1.5% | 0.85% |
Similar Demographics by 3rd Grade
Demographics Similar to Immigrants from Iran by 3rd Grade
In terms of 3rd grade, the demographic groups most similar to Immigrants from Iran are French American Indian (97.8%, a difference of 0.0%), Albanian (97.8%, a difference of 0.0%), Immigrants from Jordan (97.8%, a difference of 0.0%), Bermudan (97.8%, a difference of 0.010%), and Immigrants from Russia (97.8%, a difference of 0.010%).
| Demographics | Rating | Rank | 3rd Grade |
| Apache | 68.5 /100 | #153 | Good 97.8% |
| Immigrants | Eastern Europe | 64.1 /100 | #154 | Good 97.8% |
| Bermudans | 62.6 /100 | #155 | Good 97.8% |
| Immigrants | Russia | 61.7 /100 | #156 | Good 97.8% |
| Immigrants | Italy | 61.2 /100 | #157 | Good 97.8% |
| Venezuelans | 60.9 /100 | #158 | Good 97.8% |
| French American Indians | 60.0 /100 | #159 | Average 97.8% |
| Immigrants | Iran | 59.1 /100 | #160 | Average 97.8% |
| Albanians | 58.8 /100 | #161 | Average 97.8% |
| Immigrants | Jordan | 57.9 /100 | #162 | Average 97.8% |
| Marshallese | 57.2 /100 | #163 | Average 97.8% |
| Immigrants | Bosnia and Herzegovina | 56.2 /100 | #164 | Average 97.8% |
| Ugandans | 56.1 /100 | #165 | Average 97.8% |
| Dutch West Indians | 55.5 /100 | #166 | Average 97.8% |
| Chileans | 55.3 /100 | #167 | Average 97.8% |
Demographics Similar to Macedonians by 3rd Grade
In terms of 3rd grade, the demographic groups most similar to Macedonians are Immigrants from Belgium (98.1%, a difference of 0.0%), Icelander (98.1%, a difference of 0.0%), Immigrants from Lithuania (98.2%, a difference of 0.010%), Osage (98.2%, a difference of 0.010%), and Shoshone (98.1%, a difference of 0.010%).
| Demographics | Rating | Rank | 3rd Grade |
| Cheyenne | 99.3 /100 | #73 | Exceptional 98.2% |
| Immigrants | Netherlands | 99.3 /100 | #74 | Exceptional 98.2% |
| Cherokee | 99.3 /100 | #75 | Exceptional 98.2% |
| Immigrants | England | 99.2 /100 | #76 | Exceptional 98.2% |
| Immigrants | Lithuania | 99.2 /100 | #77 | Exceptional 98.2% |
| Osage | 99.2 /100 | #78 | Exceptional 98.2% |
| Immigrants | Belgium | 99.1 /100 | #79 | Exceptional 98.1% |
| Macedonians | 99.1 /100 | #80 | Exceptional 98.1% |
| Icelanders | 99.1 /100 | #81 | Exceptional 98.1% |
| Shoshone | 99.0 /100 | #82 | Exceptional 98.1% |
| Ukrainians | 98.9 /100 | #83 | Exceptional 98.1% |
| Immigrants | Sweden | 98.9 /100 | #84 | Exceptional 98.1% |
| Immigrants | Australia | 98.9 /100 | #85 | Exceptional 98.1% |
| Potawatomi | 98.9 /100 | #86 | Exceptional 98.1% |
| Immigrants | Denmark | 98.8 /100 | #87 | Exceptional 98.1% |