Immigrants from Cambodia vs English Unemployment Among Ages 25 to 29 years
COMPARE
Immigrants from Cambodia
English
Unemployment Among Ages 25 to 29 years
Unemployment Among Ages 25 to 29 years Comparison
Immigrants from Cambodia
English
6.6%
UNEMPLOYMENT AMONG AGES 25 TO 29 YEARS
52.6/ 100
METRIC RATING
171st/ 347
METRIC RANK
6.6%
UNEMPLOYMENT AMONG AGES 25 TO 29 YEARS
58.0/ 100
METRIC RATING
165th/ 347
METRIC RANK
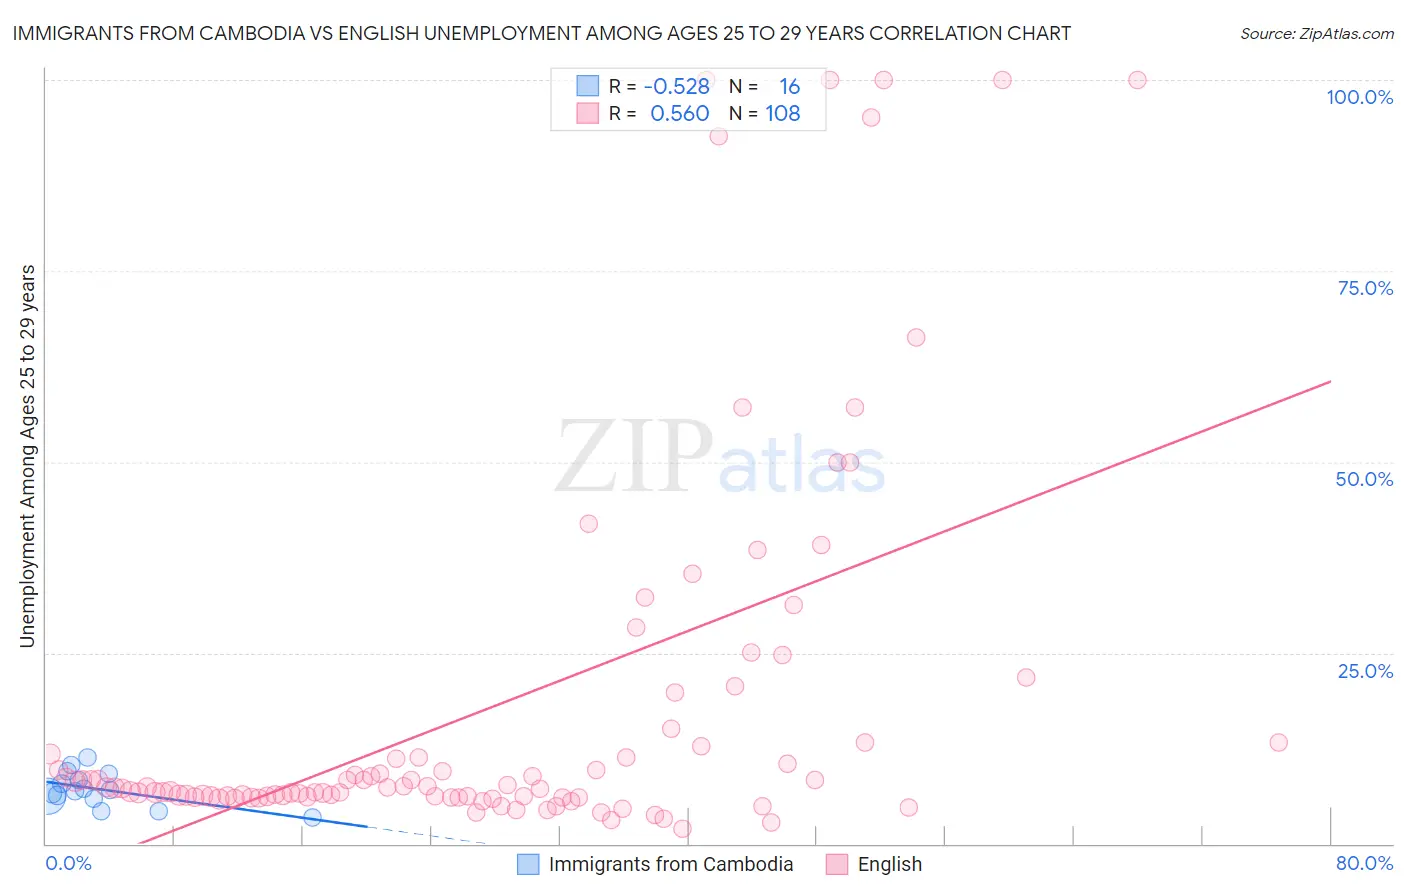
Immigrants from Cambodia vs English Unemployment Among Ages 25 to 29 years Correlation Chart
The statistical analysis conducted on geographies consisting of 201,810,068 people shows a substantial negative correlation between the proportion of Immigrants from Cambodia and unemployment rate among population between the ages 25 and 29 in the United States with a correlation coefficient (R) of -0.528 and weighted average of 6.6%. Similarly, the statistical analysis conducted on geographies consisting of 509,948,748 people shows a substantial positive correlation between the proportion of English and unemployment rate among population between the ages 25 and 29 in the United States with a correlation coefficient (R) of 0.560 and weighted average of 6.6%, a difference of 0.34%.
Unemployment Among Ages 25 to 29 years Correlation Summary
| Measurement | Immigrants from Cambodia | English |
| Minimum | 3.4% | 2.0% |
| Maximum | 11.3% | 100.0% |
| Range | 7.9% | 98.0% |
| Mean | 7.2% | 17.8% |
| Median | 7.0% | 7.4% |
| Interquartile 25% (IQ1) | 6.1% | 6.2% |
| Interquartile 75% (IQ3) | 8.8% | 13.0% |
| Interquartile Range (IQR) | 2.7% | 6.8% |
| Standard Deviation (Sample) | 2.2% | 24.7% |
| Standard Deviation (Population) | 2.1% | 24.6% |
Demographics Similar to Immigrants from Cambodia and English by Unemployment Among Ages 25 to 29 years
In terms of unemployment among ages 25 to 29 years, the demographic groups most similar to Immigrants from Cambodia are Albanian (6.6%, a difference of 0.060%), Bangladeshi (6.6%, a difference of 0.060%), Russian (6.6%, a difference of 0.080%), South American (6.6%, a difference of 0.12%), and Estonian (6.6%, a difference of 0.14%). Similarly, the demographic groups most similar to English are Greek (6.6%, a difference of 0.030%), Immigrants from Northern Europe (6.6%, a difference of 0.040%), Immigrants from Middle Africa (6.6%, a difference of 0.090%), Immigrants from Czechoslovakia (6.6%, a difference of 0.14%), and Paraguayan (6.6%, a difference of 0.16%).
| Demographics | Rating | Rank | Unemployment Among Ages 25 to 29 years |
| Immigrants | Russia | 61.5 /100 | #158 | Good 6.6% |
| Welsh | 61.3 /100 | #159 | Good 6.6% |
| Scottish | 60.7 /100 | #160 | Good 6.6% |
| Paraguayans | 60.4 /100 | #161 | Good 6.6% |
| Immigrants | Czechoslovakia | 60.2 /100 | #162 | Good 6.6% |
| Immigrants | Middle Africa | 59.4 /100 | #163 | Average 6.6% |
| Greeks | 58.5 /100 | #164 | Average 6.6% |
| English | 58.0 /100 | #165 | Average 6.6% |
| Immigrants | Northern Europe | 57.3 /100 | #166 | Average 6.6% |
| Immigrants | Canada | 55.0 /100 | #167 | Average 6.6% |
| Estonians | 54.8 /100 | #168 | Average 6.6% |
| South Americans | 54.5 /100 | #169 | Average 6.6% |
| Albanians | 53.5 /100 | #170 | Average 6.6% |
| Immigrants | Cambodia | 52.6 /100 | #171 | Average 6.6% |
| Bangladeshis | 51.6 /100 | #172 | Average 6.6% |
| Russians | 51.3 /100 | #173 | Average 6.6% |
| Immigrants | North America | 50.0 /100 | #174 | Average 6.6% |
| Immigrants | South Eastern Asia | 49.1 /100 | #175 | Average 6.7% |
| Osage | 48.1 /100 | #176 | Average 6.7% |
| Immigrants | Israel | 47.8 /100 | #177 | Average 6.7% |
| Immigrants | Iraq | 45.1 /100 | #178 | Average 6.7% |