Immigrants from Cambodia vs British Nursery School
COMPARE
Immigrants from Cambodia
British
Nursery School
Nursery School Comparison
Immigrants from Cambodia
British
96.5%
NURSERY SCHOOL
0.0/ 100
METRIC RATING
337th/ 347
METRIC RANK
98.5%
NURSERY SCHOOL
100.0/ 100
METRIC RATING
36th/ 347
METRIC RANK
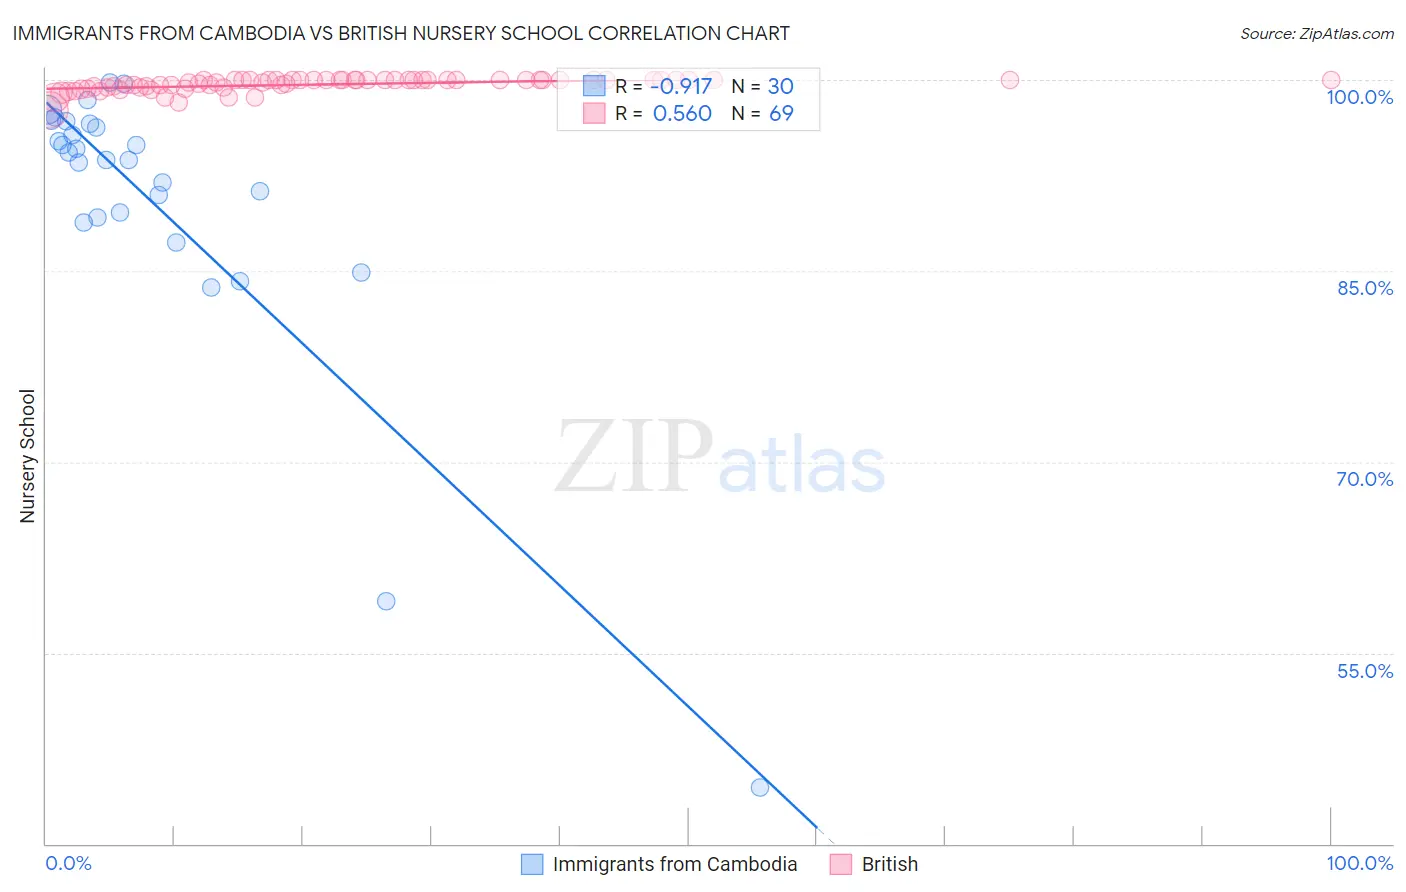
Immigrants from Cambodia vs British Nursery School Correlation Chart
The statistical analysis conducted on geographies consisting of 205,153,442 people shows a near-perfect negative correlation between the proportion of Immigrants from Cambodia and percentage of population with at least nursery school education in the United States with a correlation coefficient (R) of -0.917 and weighted average of 96.5%. Similarly, the statistical analysis conducted on geographies consisting of 531,462,526 people shows a substantial positive correlation between the proportion of British and percentage of population with at least nursery school education in the United States with a correlation coefficient (R) of 0.560 and weighted average of 98.5%, a difference of 2.1%.
Nursery School Correlation Summary
| Measurement | Immigrants from Cambodia | British |
| Minimum | 44.4% | 97.7% |
| Maximum | 99.8% | 100.0% |
| Range | 55.4% | 2.3% |
| Mean | 90.5% | 99.7% |
| Median | 94.0% | 100.0% |
| Interquartile 25% (IQ1) | 89.2% | 99.4% |
| Interquartile 75% (IQ3) | 96.6% | 100.0% |
| Interquartile Range (IQR) | 7.4% | 0.58% |
| Standard Deviation (Sample) | 11.6% | 0.50% |
| Standard Deviation (Population) | 11.4% | 0.50% |
Similar Demographics by Nursery School
Demographics Similar to Immigrants from Cambodia by Nursery School
In terms of nursery school, the demographic groups most similar to Immigrants from Cambodia are Immigrants from Fiji (96.5%, a difference of 0.0%), Guatemalan (96.6%, a difference of 0.040%), Bangladeshi (96.6%, a difference of 0.070%), Immigrants from Guatemala (96.4%, a difference of 0.080%), and Immigrants from Dominican Republic (96.6%, a difference of 0.090%).
| Demographics | Rating | Rank | Nursery School |
| Japanese | 0.0 /100 | #330 | Tragic 96.7% |
| Immigrants | Armenia | 0.0 /100 | #331 | Tragic 96.7% |
| Yakama | 0.0 /100 | #332 | Tragic 96.6% |
| Central Americans | 0.0 /100 | #333 | Tragic 96.6% |
| Immigrants | Dominican Republic | 0.0 /100 | #334 | Tragic 96.6% |
| Bangladeshis | 0.0 /100 | #335 | Tragic 96.6% |
| Guatemalans | 0.0 /100 | #336 | Tragic 96.6% |
| Immigrants | Cambodia | 0.0 /100 | #337 | Tragic 96.5% |
| Immigrants | Fiji | 0.0 /100 | #338 | Tragic 96.5% |
| Immigrants | Guatemala | 0.0 /100 | #339 | Tragic 96.4% |
| Immigrants | Central America | 0.0 /100 | #340 | Tragic 96.4% |
| Immigrants | Cabo Verde | 0.0 /100 | #341 | Tragic 96.4% |
| Immigrants | Mexico | 0.0 /100 | #342 | Tragic 96.4% |
| Salvadorans | 0.0 /100 | #343 | Tragic 96.4% |
| Immigrants | El Salvador | 0.0 /100 | #344 | Tragic 96.2% |
Demographics Similar to British by Nursery School
In terms of nursery school, the demographic groups most similar to British are Chinese (98.6%, a difference of 0.020%), Swiss (98.6%, a difference of 0.020%), Lumbee (98.5%, a difference of 0.020%), Italian (98.5%, a difference of 0.020%), and Latvian (98.5%, a difference of 0.020%).
| Demographics | Rating | Rank | Nursery School |
| French | 100.0 /100 | #29 | Exceptional 98.6% |
| Europeans | 100.0 /100 | #30 | Exceptional 98.6% |
| Czechs | 100.0 /100 | #31 | Exceptional 98.6% |
| French Canadians | 100.0 /100 | #32 | Exceptional 98.6% |
| Scandinavians | 100.0 /100 | #33 | Exceptional 98.6% |
| Chinese | 100.0 /100 | #34 | Exceptional 98.6% |
| Swiss | 100.0 /100 | #35 | Exceptional 98.6% |
| British | 100.0 /100 | #36 | Exceptional 98.5% |
| Lumbee | 99.9 /100 | #37 | Exceptional 98.5% |
| Italians | 99.9 /100 | #38 | Exceptional 98.5% |
| Latvians | 99.9 /100 | #39 | Exceptional 98.5% |
| Chippewa | 99.9 /100 | #40 | Exceptional 98.5% |
| Luxembourgers | 99.9 /100 | #41 | Exceptional 98.5% |
| Eastern Europeans | 99.9 /100 | #42 | Exceptional 98.5% |
| Native Hawaiians | 99.9 /100 | #43 | Exceptional 98.5% |