Immigrants from Cambodia vs Immigrants from Ireland Nursery School
COMPARE
Immigrants from Cambodia
Immigrants from Ireland
Nursery School
Nursery School Comparison
Immigrants from Cambodia
Immigrants from Ireland
96.5%
NURSERY SCHOOL
0.0/ 100
METRIC RATING
337th/ 347
METRIC RANK
98.3%
NURSERY SCHOOL
97.7/ 100
METRIC RATING
102nd/ 347
METRIC RANK
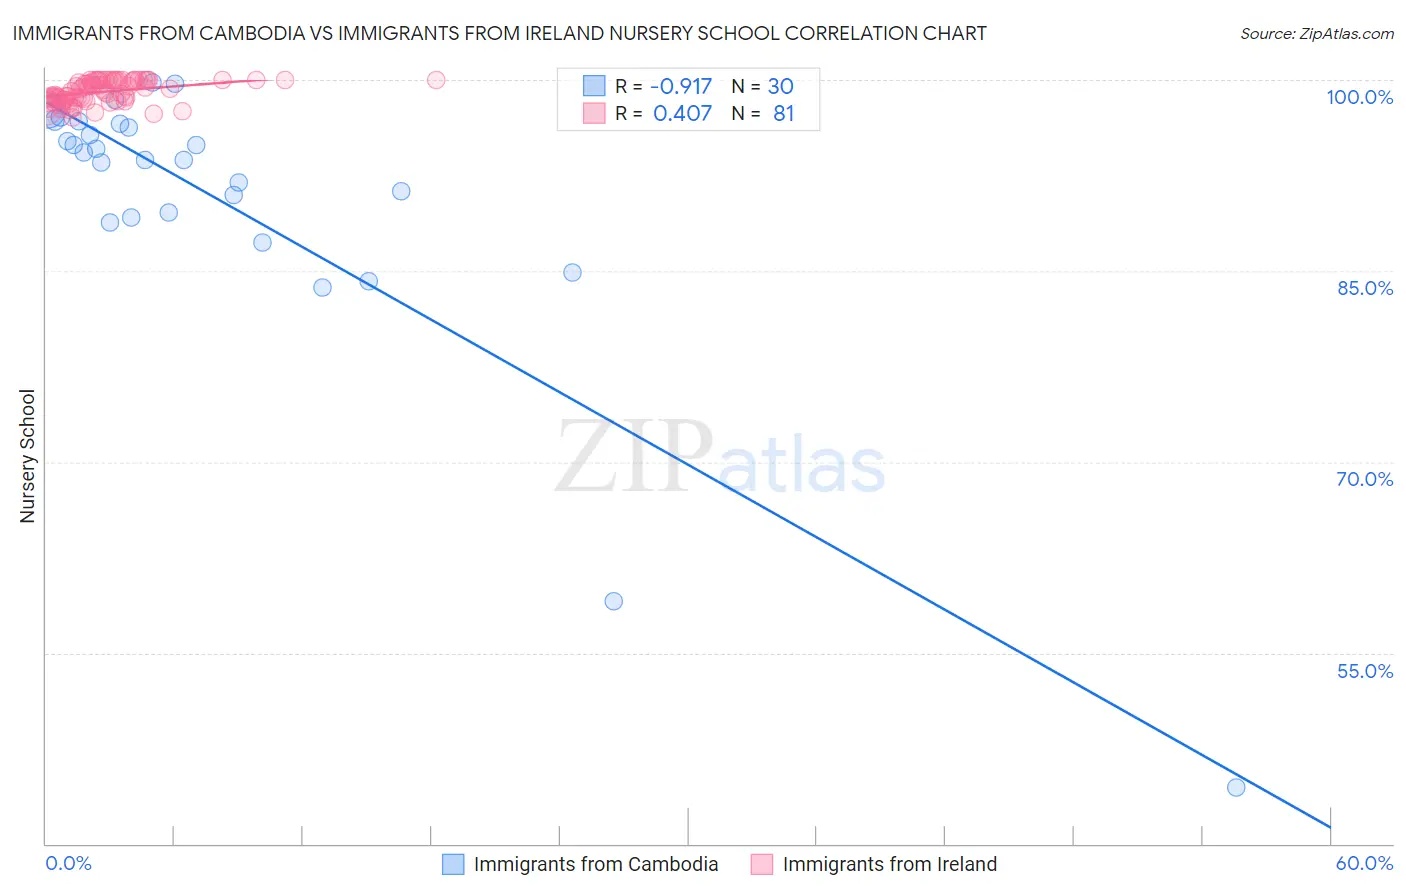
Immigrants from Cambodia vs Immigrants from Ireland Nursery School Correlation Chart
The statistical analysis conducted on geographies consisting of 205,153,442 people shows a near-perfect negative correlation between the proportion of Immigrants from Cambodia and percentage of population with at least nursery school education in the United States with a correlation coefficient (R) of -0.917 and weighted average of 96.5%. Similarly, the statistical analysis conducted on geographies consisting of 240,784,498 people shows a moderate positive correlation between the proportion of Immigrants from Ireland and percentage of population with at least nursery school education in the United States with a correlation coefficient (R) of 0.407 and weighted average of 98.3%, a difference of 1.8%.
Nursery School Correlation Summary
| Measurement | Immigrants from Cambodia | Immigrants from Ireland |
| Minimum | 44.4% | 97.1% |
| Maximum | 99.8% | 100.0% |
| Range | 55.4% | 2.9% |
| Mean | 90.5% | 99.1% |
| Median | 94.0% | 99.2% |
| Interquartile 25% (IQ1) | 89.2% | 98.4% |
| Interquartile 75% (IQ3) | 96.6% | 100.0% |
| Interquartile Range (IQR) | 7.4% | 1.6% |
| Standard Deviation (Sample) | 11.6% | 0.84% |
| Standard Deviation (Population) | 11.4% | 0.84% |
Similar Demographics by Nursery School
Demographics Similar to Immigrants from Cambodia by Nursery School
In terms of nursery school, the demographic groups most similar to Immigrants from Cambodia are Immigrants from Fiji (96.5%, a difference of 0.0%), Guatemalan (96.6%, a difference of 0.040%), Bangladeshi (96.6%, a difference of 0.070%), Immigrants from Guatemala (96.4%, a difference of 0.080%), and Immigrants from Dominican Republic (96.6%, a difference of 0.090%).
| Demographics | Rating | Rank | Nursery School |
| Japanese | 0.0 /100 | #330 | Tragic 96.7% |
| Immigrants | Armenia | 0.0 /100 | #331 | Tragic 96.7% |
| Yakama | 0.0 /100 | #332 | Tragic 96.6% |
| Central Americans | 0.0 /100 | #333 | Tragic 96.6% |
| Immigrants | Dominican Republic | 0.0 /100 | #334 | Tragic 96.6% |
| Bangladeshis | 0.0 /100 | #335 | Tragic 96.6% |
| Guatemalans | 0.0 /100 | #336 | Tragic 96.6% |
| Immigrants | Cambodia | 0.0 /100 | #337 | Tragic 96.5% |
| Immigrants | Fiji | 0.0 /100 | #338 | Tragic 96.5% |
| Immigrants | Guatemala | 0.0 /100 | #339 | Tragic 96.4% |
| Immigrants | Central America | 0.0 /100 | #340 | Tragic 96.4% |
| Immigrants | Cabo Verde | 0.0 /100 | #341 | Tragic 96.4% |
| Immigrants | Mexico | 0.0 /100 | #342 | Tragic 96.4% |
| Salvadorans | 0.0 /100 | #343 | Tragic 96.4% |
| Immigrants | El Salvador | 0.0 /100 | #344 | Tragic 96.2% |
Demographics Similar to Immigrants from Ireland by Nursery School
In terms of nursery school, the demographic groups most similar to Immigrants from Ireland are Cree (98.3%, a difference of 0.0%), Puget Sound Salish (98.3%, a difference of 0.010%), Romanian (98.3%, a difference of 0.010%), Bhutanese (98.2%, a difference of 0.010%), and Turkish (98.2%, a difference of 0.010%).
| Demographics | Rating | Rank | Nursery School |
| South Africans | 98.6 /100 | #95 | Exceptional 98.3% |
| Cypriots | 98.3 /100 | #96 | Exceptional 98.3% |
| Immigrants | Nonimmigrants | 98.3 /100 | #97 | Exceptional 98.3% |
| Choctaw | 98.3 /100 | #98 | Exceptional 98.3% |
| Colville | 98.2 /100 | #99 | Exceptional 98.3% |
| Puget Sound Salish | 98.0 /100 | #100 | Exceptional 98.3% |
| Romanians | 97.9 /100 | #101 | Exceptional 98.3% |
| Immigrants | Ireland | 97.7 /100 | #102 | Exceptional 98.3% |
| Cree | 97.7 /100 | #103 | Exceptional 98.3% |
| Bhutanese | 97.4 /100 | #104 | Exceptional 98.2% |
| Turks | 97.4 /100 | #105 | Exceptional 98.2% |
| Immigrants | Switzerland | 97.3 /100 | #106 | Exceptional 98.2% |
| Basques | 97.3 /100 | #107 | Exceptional 98.2% |
| Pima | 97.1 /100 | #108 | Exceptional 98.2% |
| German Russians | 97.1 /100 | #109 | Exceptional 98.2% |