Immigrants from Cabo Verde vs Apache 1st Grade
COMPARE
Immigrants from Cabo Verde
Apache
1st Grade
1st Grade Comparison
Immigrants from Cabo Verde
Apache
96.3%
1ST GRADE
0.0/ 100
METRIC RATING
340th/ 347
METRIC RANK
98.0%
1ST GRADE
75.2/ 100
METRIC RATING
148th/ 347
METRIC RANK
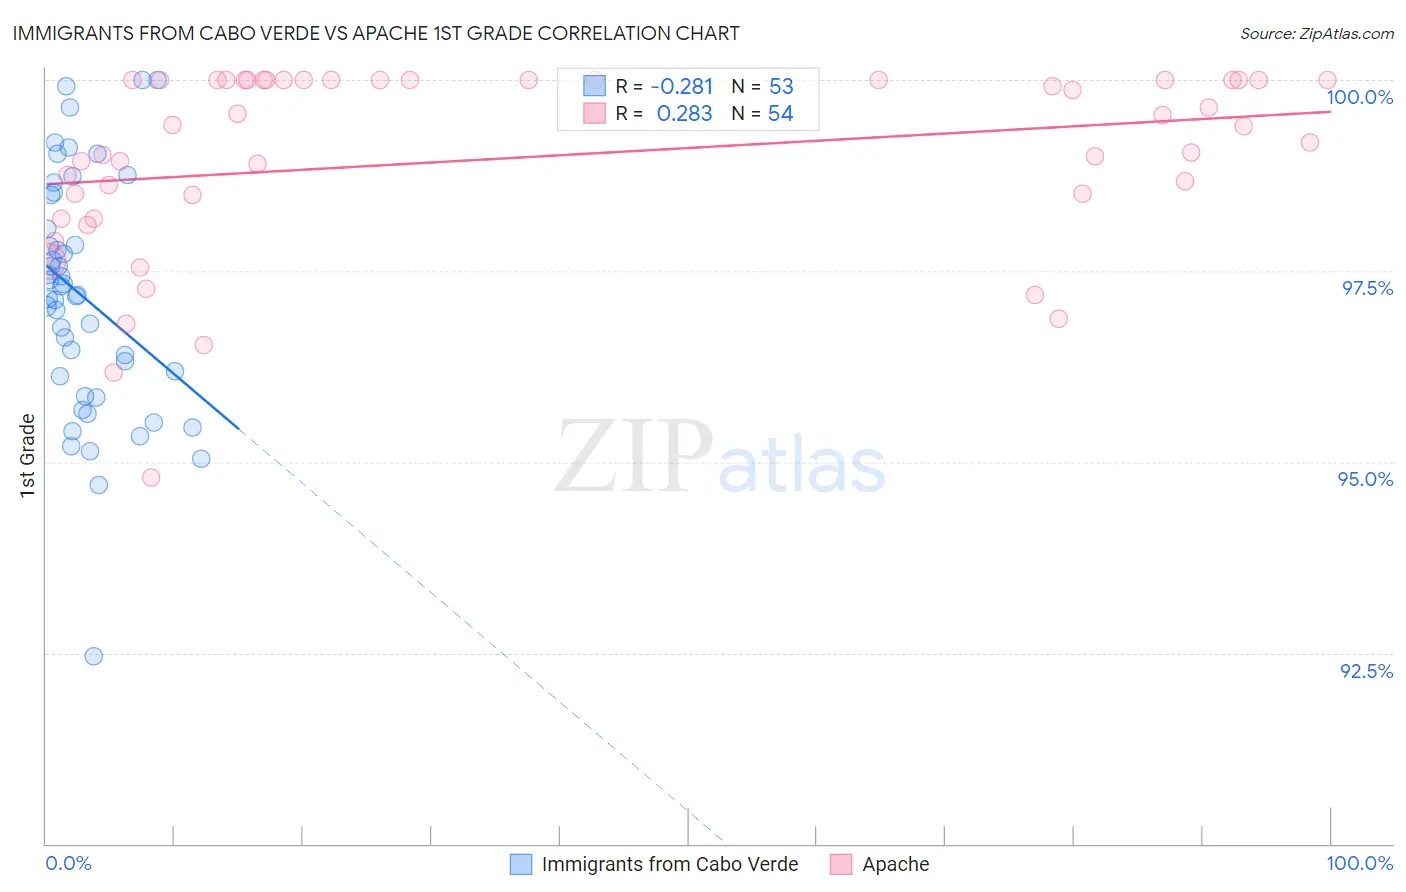
Immigrants from Cabo Verde vs Apache 1st Grade Correlation Chart
The statistical analysis conducted on geographies consisting of 38,158,666 people shows a weak negative correlation between the proportion of Immigrants from Cabo Verde and percentage of population with at least 1st grade education in the United States with a correlation coefficient (R) of -0.281 and weighted average of 96.3%. Similarly, the statistical analysis conducted on geographies consisting of 231,142,814 people shows a weak positive correlation between the proportion of Apache and percentage of population with at least 1st grade education in the United States with a correlation coefficient (R) of 0.283 and weighted average of 98.0%, a difference of 1.7%.
1st Grade Correlation Summary
| Measurement | Immigrants from Cabo Verde | Apache |
| Minimum | 92.5% | 94.8% |
| Maximum | 100.0% | 100.0% |
| Range | 7.5% | 5.2% |
| Mean | 97.2% | 99.0% |
| Median | 97.2% | 99.4% |
| Interquartile 25% (IQ1) | 96.0% | 98.5% |
| Interquartile 75% (IQ3) | 98.3% | 100.0% |
| Interquartile Range (IQR) | 2.3% | 1.5% |
| Standard Deviation (Sample) | 1.5% | 1.2% |
| Standard Deviation (Population) | 1.5% | 1.2% |
Similar Demographics by 1st Grade
Demographics Similar to Immigrants from Cabo Verde by 1st Grade
In terms of 1st grade, the demographic groups most similar to Immigrants from Cabo Verde are Immigrants from Guatemala (96.4%, a difference of 0.020%), Immigrants from Central America (96.3%, a difference of 0.020%), Immigrants from Mexico (96.3%, a difference of 0.050%), Salvadoran (96.3%, a difference of 0.080%), and Immigrants from Fiji (96.4%, a difference of 0.090%).
| Demographics | Rating | Rank | 1st Grade |
| Immigrants | Dominican Republic | 0.0 /100 | #333 | Tragic 96.5% |
| Bangladeshis | 0.0 /100 | #334 | Tragic 96.5% |
| Yakama | 0.0 /100 | #335 | Tragic 96.5% |
| Guatemalans | 0.0 /100 | #336 | Tragic 96.5% |
| Immigrants | Cambodia | 0.0 /100 | #337 | Tragic 96.5% |
| Immigrants | Fiji | 0.0 /100 | #338 | Tragic 96.4% |
| Immigrants | Guatemala | 0.0 /100 | #339 | Tragic 96.4% |
| Immigrants | Cabo Verde | 0.0 /100 | #340 | Tragic 96.3% |
| Immigrants | Central America | 0.0 /100 | #341 | Tragic 96.3% |
| Immigrants | Mexico | 0.0 /100 | #342 | Tragic 96.3% |
| Salvadorans | 0.0 /100 | #343 | Tragic 96.3% |
| Nepalese | 0.0 /100 | #344 | Tragic 96.1% |
| Immigrants | El Salvador | 0.0 /100 | #345 | Tragic 96.1% |
| Immigrants | Yemen | 0.0 /100 | #346 | Tragic 95.8% |
| Spanish American Indians | 0.0 /100 | #347 | Tragic 95.7% |
Demographics Similar to Apache by 1st Grade
In terms of 1st grade, the demographic groups most similar to Apache are Immigrants from Greece (98.0%, a difference of 0.0%), Immigrants from Israel (98.0%, a difference of 0.010%), Filipino (98.0%, a difference of 0.010%), Jordanian (98.0%, a difference of 0.010%), and Hmong (98.0%, a difference of 0.020%).
| Demographics | Rating | Rank | 1st Grade |
| Immigrants | Turkey | 82.8 /100 | #141 | Excellent 98.0% |
| Marshallese | 82.0 /100 | #142 | Excellent 98.0% |
| Burmese | 81.0 /100 | #143 | Excellent 98.0% |
| Alsatians | 80.9 /100 | #144 | Excellent 98.0% |
| Hmong | 79.0 /100 | #145 | Good 98.0% |
| Immigrants | Israel | 77.8 /100 | #146 | Good 98.0% |
| Filipinos | 77.6 /100 | #147 | Good 98.0% |
| Apache | 75.2 /100 | #148 | Good 98.0% |
| Immigrants | Greece | 74.9 /100 | #149 | Good 98.0% |
| Jordanians | 72.7 /100 | #150 | Good 98.0% |
| Dutch West Indians | 69.8 /100 | #151 | Good 98.0% |
| Immigrants | Moldova | 69.5 /100 | #152 | Good 98.0% |
| Soviet Union | 68.9 /100 | #153 | Good 98.0% |
| Immigrants | Iran | 66.9 /100 | #154 | Good 98.0% |
| Comanche | 66.9 /100 | #155 | Good 98.0% |