Immigrants from Burma/Myanmar vs Immigrants from Asia 8th Grade
COMPARE
Immigrants from Burma/Myanmar
Immigrants from Asia
8th Grade
8th Grade Comparison
Immigrants from Burma/Myanmar
Immigrants from Asia
94.1%
8TH GRADE
0.0/ 100
METRIC RATING
300th/ 347
METRIC RANK
95.2%
8TH GRADE
3.1/ 100
METRIC RATING
233rd/ 347
METRIC RANK
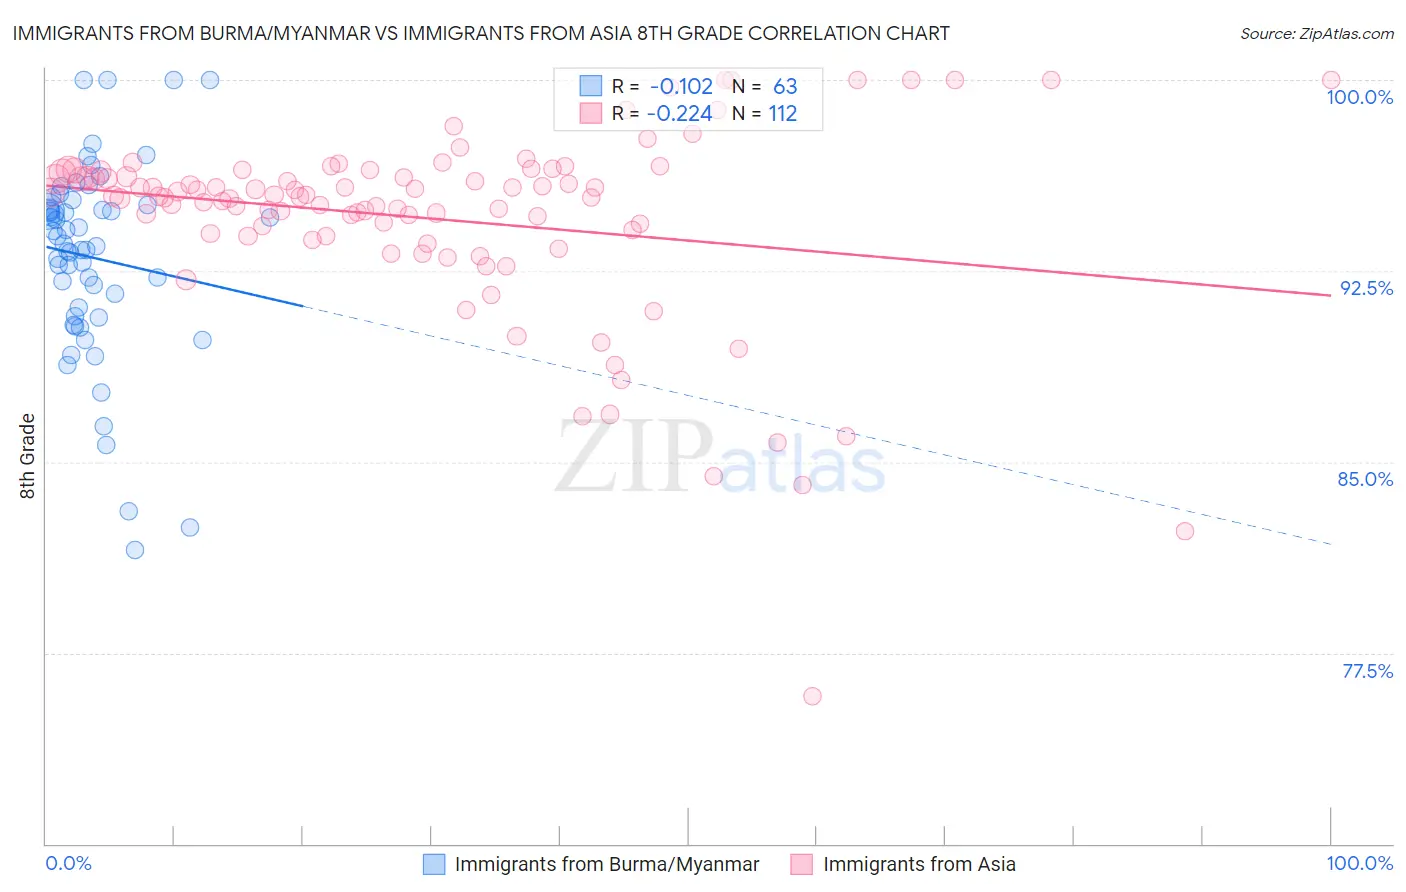
Immigrants from Burma/Myanmar vs Immigrants from Asia 8th Grade Correlation Chart
The statistical analysis conducted on geographies consisting of 172,345,696 people shows a poor negative correlation between the proportion of Immigrants from Burma/Myanmar and percentage of population with at least 8th grade education in the United States with a correlation coefficient (R) of -0.102 and weighted average of 94.1%. Similarly, the statistical analysis conducted on geographies consisting of 549,167,442 people shows a weak negative correlation between the proportion of Immigrants from Asia and percentage of population with at least 8th grade education in the United States with a correlation coefficient (R) of -0.224 and weighted average of 95.2%, a difference of 1.1%.
8th Grade Correlation Summary
| Measurement | Immigrants from Burma/Myanmar | Immigrants from Asia |
| Minimum | 81.5% | 75.8% |
| Maximum | 100.0% | 100.0% |
| Range | 18.5% | 24.2% |
| Mean | 93.0% | 94.6% |
| Median | 93.5% | 95.4% |
| Interquartile 25% (IQ1) | 90.7% | 93.9% |
| Interquartile 75% (IQ3) | 95.1% | 96.4% |
| Interquartile Range (IQR) | 4.4% | 2.5% |
| Standard Deviation (Sample) | 3.9% | 3.8% |
| Standard Deviation (Population) | 3.9% | 3.8% |
Similar Demographics by 8th Grade
Demographics Similar to Immigrants from Burma/Myanmar by 8th Grade
In terms of 8th grade, the demographic groups most similar to Immigrants from Burma/Myanmar are Cuban (94.1%, a difference of 0.010%), Immigrants from Laos (94.1%, a difference of 0.020%), Indonesian (94.1%, a difference of 0.030%), Immigrants from South Eastern Asia (94.2%, a difference of 0.070%), and Haitian (94.2%, a difference of 0.080%).
| Demographics | Rating | Rank | 8th Grade |
| Yaqui | 0.0 /100 | #293 | Tragic 94.2% |
| Houma | 0.0 /100 | #294 | Tragic 94.2% |
| Fijians | 0.0 /100 | #295 | Tragic 94.2% |
| Haitians | 0.0 /100 | #296 | Tragic 94.2% |
| Immigrants | South Eastern Asia | 0.0 /100 | #297 | Tragic 94.2% |
| Indonesians | 0.0 /100 | #298 | Tragic 94.1% |
| Cubans | 0.0 /100 | #299 | Tragic 94.1% |
| Immigrants | Burma/Myanmar | 0.0 /100 | #300 | Tragic 94.1% |
| Immigrants | Laos | 0.0 /100 | #301 | Tragic 94.1% |
| Sri Lankans | 0.0 /100 | #302 | Tragic 94.0% |
| Immigrants | Dominica | 0.0 /100 | #303 | Tragic 94.0% |
| Guyanese | 0.0 /100 | #304 | Tragic 93.9% |
| Immigrants | Haiti | 0.0 /100 | #305 | Tragic 93.9% |
| Immigrants | Guyana | 0.0 /100 | #306 | Tragic 93.8% |
| Immigrants | Portugal | 0.0 /100 | #307 | Tragic 93.8% |
Demographics Similar to Immigrants from Asia by 8th Grade
In terms of 8th grade, the demographic groups most similar to Immigrants from Asia are Costa Rican (95.2%, a difference of 0.0%), Indian (Asian) (95.2%, a difference of 0.010%), Nigerian (95.2%, a difference of 0.010%), Asian (95.2%, a difference of 0.020%), and Senegalese (95.2%, a difference of 0.020%).
| Demographics | Rating | Rank | 8th Grade |
| Navajo | 5.7 /100 | #226 | Tragic 95.3% |
| Bahamians | 5.6 /100 | #227 | Tragic 95.3% |
| Immigrants | Eastern Africa | 5.6 /100 | #228 | Tragic 95.3% |
| Immigrants | Indonesia | 4.4 /100 | #229 | Tragic 95.3% |
| Immigrants | Panama | 4.1 /100 | #230 | Tragic 95.2% |
| Asians | 3.5 /100 | #231 | Tragic 95.2% |
| Indians (Asian) | 3.3 /100 | #232 | Tragic 95.2% |
| Immigrants | Asia | 3.1 /100 | #233 | Tragic 95.2% |
| Costa Ricans | 3.0 /100 | #234 | Tragic 95.2% |
| Nigerians | 2.9 /100 | #235 | Tragic 95.2% |
| Senegalese | 2.7 /100 | #236 | Tragic 95.2% |
| Immigrants | Africa | 2.7 /100 | #237 | Tragic 95.2% |
| Natives/Alaskans | 2.3 /100 | #238 | Tragic 95.2% |
| Immigrants | Sierra Leone | 2.1 /100 | #239 | Tragic 95.1% |
| Ethiopians | 2.0 /100 | #240 | Tragic 95.1% |