Immigrants from Vietnam vs Immigrants from Latin America 5th Grade
COMPARE
Immigrants from Vietnam
Immigrants from Latin America
5th Grade
5th Grade Comparison
Immigrants from Vietnam
Immigrants from Latin America
95.8%
5TH GRADE
0.0/ 100
METRIC RATING
318th/ 347
METRIC RANK
95.3%
5TH GRADE
0.0/ 100
METRIC RATING
333rd/ 347
METRIC RANK
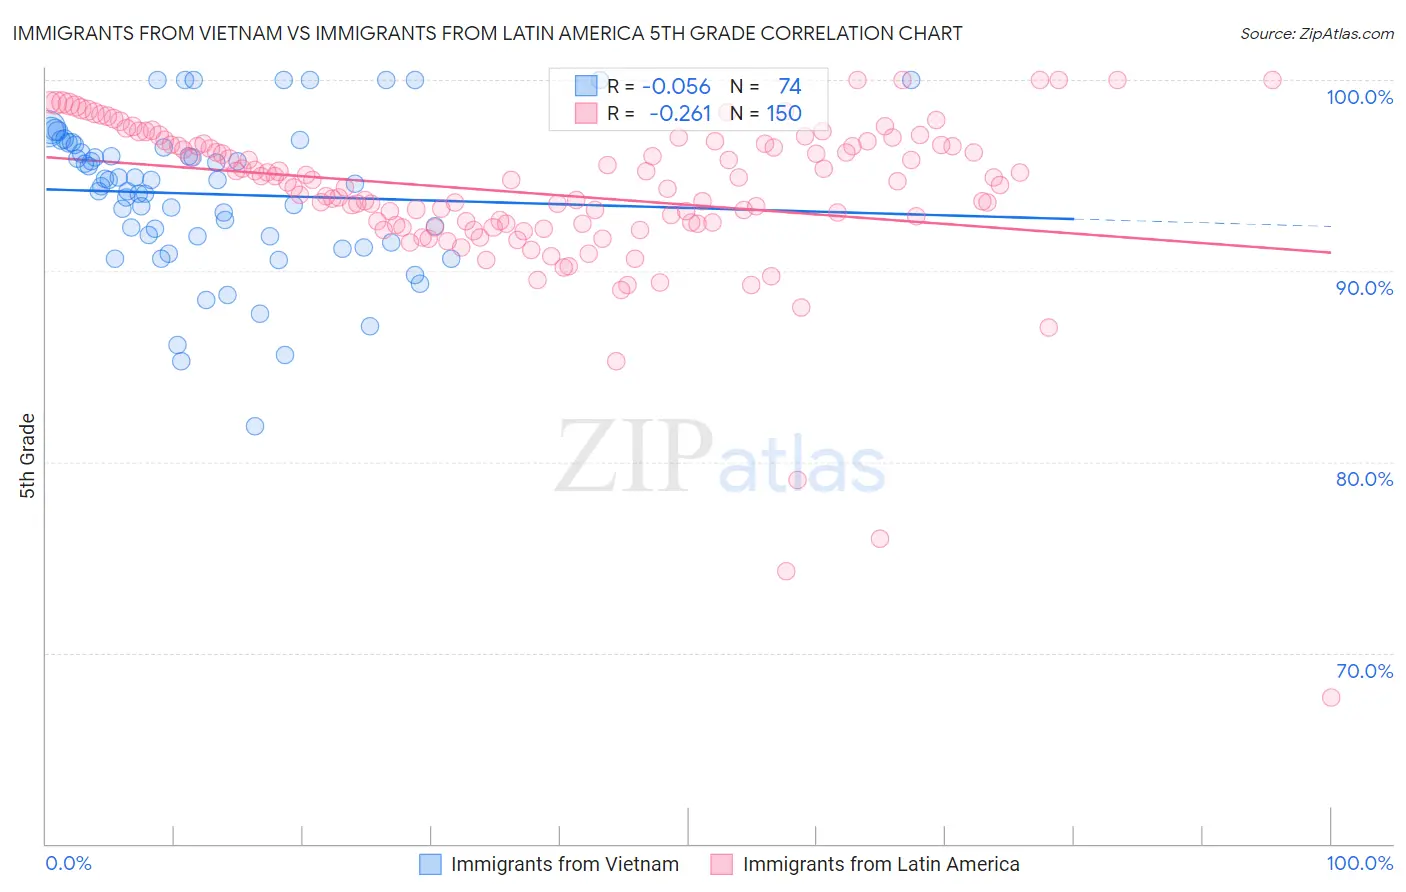
Immigrants from Vietnam vs Immigrants from Latin America 5th Grade Correlation Chart
The statistical analysis conducted on geographies consisting of 404,844,130 people shows a slight negative correlation between the proportion of Immigrants from Vietnam and percentage of population with at least 5th grade education in the United States with a correlation coefficient (R) of -0.056 and weighted average of 95.8%. Similarly, the statistical analysis conducted on geographies consisting of 558,652,717 people shows a weak negative correlation between the proportion of Immigrants from Latin America and percentage of population with at least 5th grade education in the United States with a correlation coefficient (R) of -0.261 and weighted average of 95.3%, a difference of 0.53%.
5th Grade Correlation Summary
| Measurement | Immigrants from Vietnam | Immigrants from Latin America |
| Minimum | 81.9% | 67.7% |
| Maximum | 100.0% | 100.0% |
| Range | 18.1% | 32.3% |
| Mean | 94.0% | 94.1% |
| Median | 94.6% | 94.6% |
| Interquartile 25% (IQ1) | 91.8% | 92.4% |
| Interquartile 75% (IQ3) | 96.6% | 96.7% |
| Interquartile Range (IQR) | 4.8% | 4.2% |
| Standard Deviation (Sample) | 3.9% | 4.4% |
| Standard Deviation (Population) | 3.9% | 4.4% |
Demographics Similar to Immigrants from Vietnam and Immigrants from Latin America by 5th Grade
In terms of 5th grade, the demographic groups most similar to Immigrants from Vietnam are Belizean (95.8%, a difference of 0.030%), Immigrants from Ecuador (95.8%, a difference of 0.050%), Japanese (95.7%, a difference of 0.050%), Central American Indian (95.7%, a difference of 0.050%), and Nicaraguan (95.9%, a difference of 0.12%). Similarly, the demographic groups most similar to Immigrants from Latin America are Immigrants from Dominican Republic (95.3%, a difference of 0.0%), Nepalese (95.2%, a difference of 0.030%), Mexican (95.2%, a difference of 0.050%), Immigrants from Honduras (95.4%, a difference of 0.11%), and Immigrants from Armenia (95.4%, a difference of 0.15%).
| Demographics | Rating | Rank | 5th Grade |
| Nicaraguans | 0.0 /100 | #315 | Tragic 95.9% |
| Immigrants | Ecuador | 0.0 /100 | #316 | Tragic 95.8% |
| Belizeans | 0.0 /100 | #317 | Tragic 95.8% |
| Immigrants | Vietnam | 0.0 /100 | #318 | Tragic 95.8% |
| Japanese | 0.0 /100 | #319 | Tragic 95.7% |
| Central American Indians | 0.0 /100 | #320 | Tragic 95.7% |
| Immigrants | Belize | 0.0 /100 | #321 | Tragic 95.7% |
| Immigrants | Nicaragua | 0.0 /100 | #322 | Tragic 95.6% |
| Immigrants | Fiji | 0.0 /100 | #323 | Tragic 95.6% |
| Hondurans | 0.0 /100 | #324 | Tragic 95.6% |
| Hispanics or Latinos | 0.0 /100 | #325 | Tragic 95.6% |
| Immigrants | Cambodia | 0.0 /100 | #326 | Tragic 95.5% |
| Dominicans | 0.0 /100 | #327 | Tragic 95.5% |
| Cape Verdeans | 0.0 /100 | #328 | Tragic 95.5% |
| Mexican American Indians | 0.0 /100 | #329 | Tragic 95.5% |
| Immigrants | Armenia | 0.0 /100 | #330 | Tragic 95.4% |
| Immigrants | Honduras | 0.0 /100 | #331 | Tragic 95.4% |
| Immigrants | Dominican Republic | 0.0 /100 | #332 | Tragic 95.3% |
| Immigrants | Latin America | 0.0 /100 | #333 | Tragic 95.3% |
| Nepalese | 0.0 /100 | #334 | Tragic 95.2% |
| Mexicans | 0.0 /100 | #335 | Tragic 95.2% |