Immigrants from Nicaragua vs Blackfeet 3rd Grade
COMPARE
Immigrants from Nicaragua
Blackfeet
3rd Grade
3rd Grade Comparison
Immigrants from Nicaragua
Blackfeet
96.5%
3RD GRADE
0.0/ 100
METRIC RATING
320th/ 347
METRIC RANK
97.9%
3RD GRADE
86.3/ 100
METRIC RATING
139th/ 347
METRIC RANK
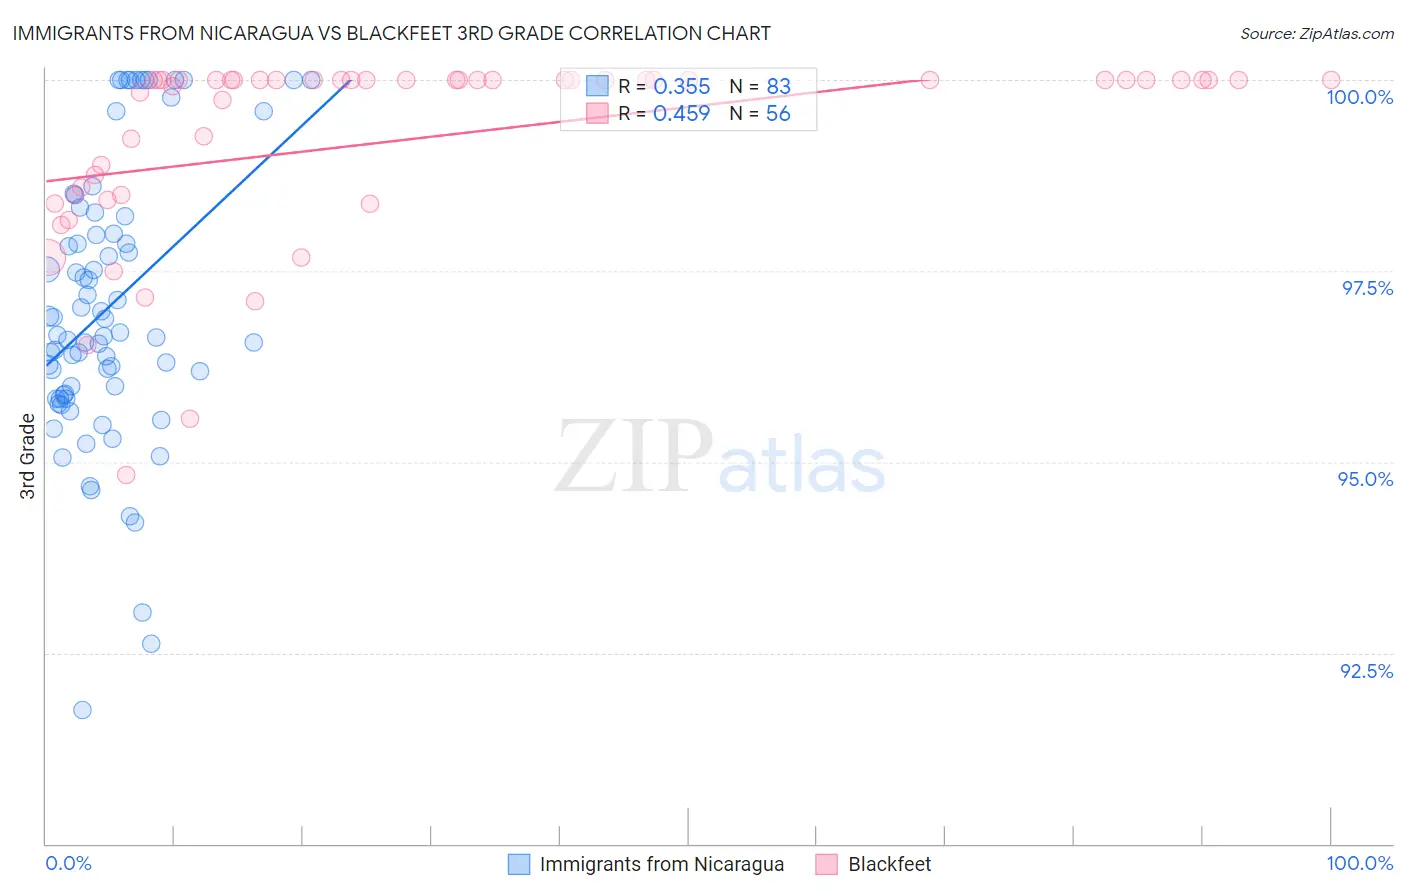
Immigrants from Nicaragua vs Blackfeet 3rd Grade Correlation Chart
The statistical analysis conducted on geographies consisting of 236,332,861 people shows a mild positive correlation between the proportion of Immigrants from Nicaragua and percentage of population with at least 3rd grade education in the United States with a correlation coefficient (R) of 0.355 and weighted average of 96.5%. Similarly, the statistical analysis conducted on geographies consisting of 309,580,957 people shows a moderate positive correlation between the proportion of Blackfeet and percentage of population with at least 3rd grade education in the United States with a correlation coefficient (R) of 0.459 and weighted average of 97.9%, a difference of 1.5%.
3rd Grade Correlation Summary
| Measurement | Immigrants from Nicaragua | Blackfeet |
| Minimum | 91.7% | 94.8% |
| Maximum | 100.0% | 100.0% |
| Range | 8.3% | 5.2% |
| Mean | 97.0% | 99.2% |
| Median | 96.7% | 100.0% |
| Interquartile 25% (IQ1) | 95.9% | 98.5% |
| Interquartile 75% (IQ3) | 98.2% | 100.0% |
| Interquartile Range (IQR) | 2.3% | 1.5% |
| Standard Deviation (Sample) | 1.8% | 1.2% |
| Standard Deviation (Population) | 1.8% | 1.2% |
Similar Demographics by 3rd Grade
Demographics Similar to Immigrants from Nicaragua by 3rd Grade
In terms of 3rd grade, the demographic groups most similar to Immigrants from Nicaragua are Indonesian (96.5%, a difference of 0.0%), Immigrants from Belize (96.5%, a difference of 0.0%), Vietnamese (96.5%, a difference of 0.010%), Hispanic or Latino (96.5%, a difference of 0.020%), and Honduran (96.5%, a difference of 0.020%).
| Demographics | Rating | Rank | 3rd Grade |
| Immigrants | Ecuador | 0.0 /100 | #313 | Tragic 96.6% |
| Belizeans | 0.0 /100 | #314 | Tragic 96.6% |
| Immigrants | Azores | 0.0 /100 | #315 | Tragic 96.6% |
| Immigrants | Burma/Myanmar | 0.0 /100 | #316 | Tragic 96.6% |
| Immigrants | Bangladesh | 0.0 /100 | #317 | Tragic 96.6% |
| Hispanics or Latinos | 0.0 /100 | #318 | Tragic 96.5% |
| Vietnamese | 0.0 /100 | #319 | Tragic 96.5% |
| Immigrants | Nicaragua | 0.0 /100 | #320 | Tragic 96.5% |
| Indonesians | 0.0 /100 | #321 | Tragic 96.5% |
| Immigrants | Belize | 0.0 /100 | #322 | Tragic 96.5% |
| Hondurans | 0.0 /100 | #323 | Tragic 96.5% |
| Dominicans | 0.0 /100 | #324 | Tragic 96.4% |
| Mexican American Indians | 0.0 /100 | #325 | Tragic 96.4% |
| Immigrants | Vietnam | 0.0 /100 | #326 | Tragic 96.4% |
| Japanese | 0.0 /100 | #327 | Tragic 96.4% |
Demographics Similar to Blackfeet by 3rd Grade
In terms of 3rd grade, the demographic groups most similar to Blackfeet are Israeli (97.9%, a difference of 0.0%), Cambodian (97.9%, a difference of 0.010%), Spaniard (97.9%, a difference of 0.010%), Immigrants from Romania (97.9%, a difference of 0.010%), and Palestinian (97.9%, a difference of 0.010%).
| Demographics | Rating | Rank | 3rd Grade |
| Immigrants | Hungary | 88.8 /100 | #132 | Excellent 97.9% |
| Immigrants | Kuwait | 88.7 /100 | #133 | Excellent 97.9% |
| Seminole | 88.7 /100 | #134 | Excellent 97.9% |
| Cambodians | 88.1 /100 | #135 | Excellent 97.9% |
| Spaniards | 87.9 /100 | #136 | Excellent 97.9% |
| Immigrants | Romania | 87.9 /100 | #137 | Excellent 97.9% |
| Israelis | 86.6 /100 | #138 | Excellent 97.9% |
| Blackfeet | 86.3 /100 | #139 | Excellent 97.9% |
| Palestinians | 84.6 /100 | #140 | Excellent 97.9% |
| Immigrants | Turkey | 83.5 /100 | #141 | Excellent 97.9% |
| Hmong | 80.3 /100 | #142 | Excellent 97.9% |
| Filipinos | 79.9 /100 | #143 | Good 97.9% |
| Burmese | 79.6 /100 | #144 | Good 97.9% |
| Immigrants | Greece | 79.5 /100 | #145 | Good 97.9% |
| Alsatians | 78.3 /100 | #146 | Good 97.9% |