Immigrants from Brazil vs Czech Nursery School
COMPARE
Immigrants from Brazil
Czech
Nursery School
Nursery School Comparison
Immigrants from Brazil
Czechs
98.0%
NURSERY SCHOOL
51.3/ 100
METRIC RATING
172nd/ 347
METRIC RANK
98.6%
NURSERY SCHOOL
100.0/ 100
METRIC RATING
31st/ 347
METRIC RANK
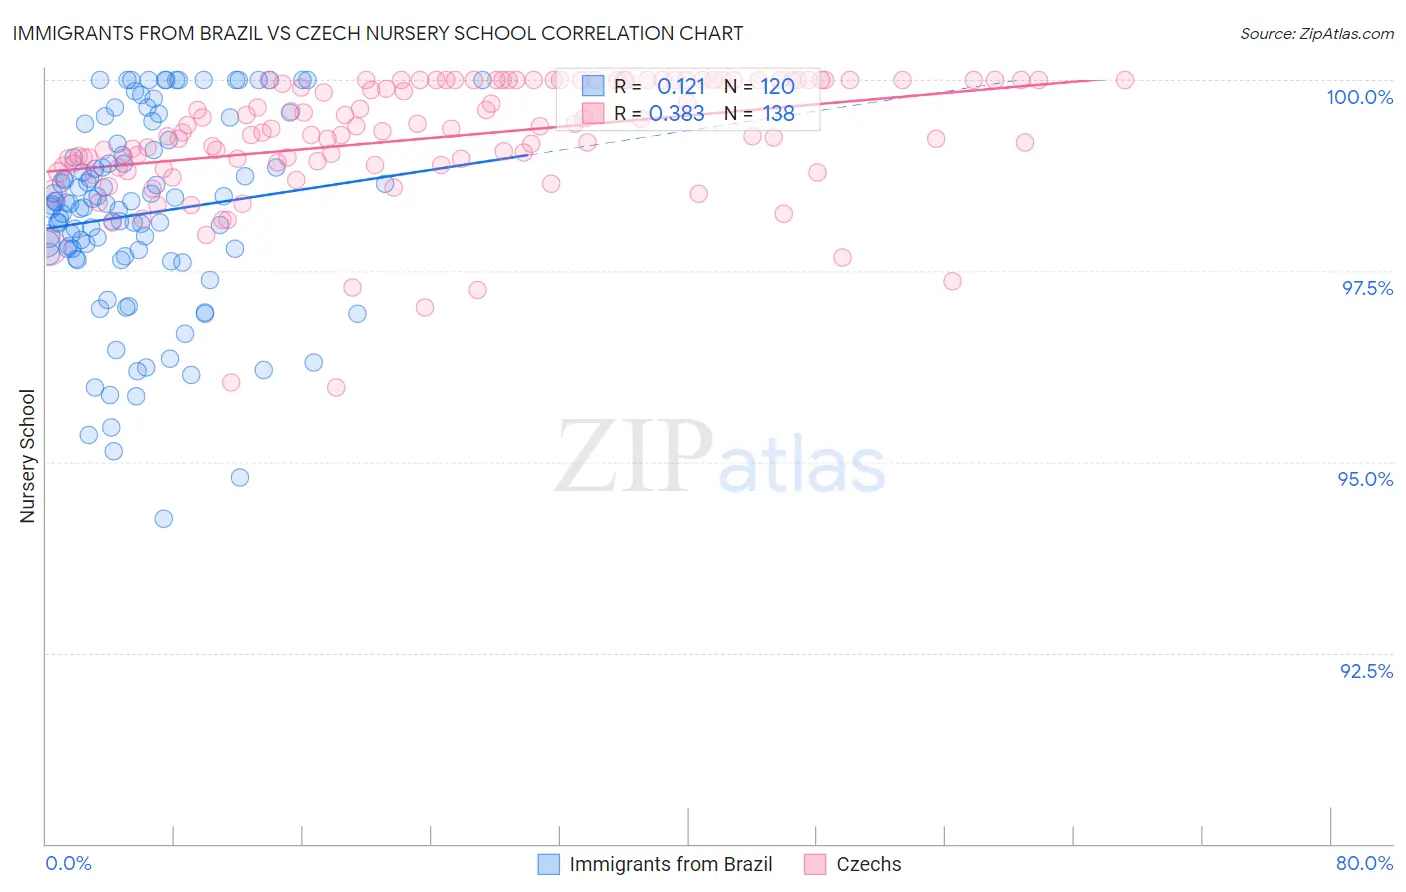
Immigrants from Brazil vs Czech Nursery School Correlation Chart
The statistical analysis conducted on geographies consisting of 343,021,580 people shows a poor positive correlation between the proportion of Immigrants from Brazil and percentage of population with at least nursery school education in the United States with a correlation coefficient (R) of 0.121 and weighted average of 98.0%. Similarly, the statistical analysis conducted on geographies consisting of 484,813,102 people shows a mild positive correlation between the proportion of Czechs and percentage of population with at least nursery school education in the United States with a correlation coefficient (R) of 0.383 and weighted average of 98.6%, a difference of 0.62%.
Nursery School Correlation Summary
| Measurement | Immigrants from Brazil | Czech |
| Minimum | 94.3% | 96.0% |
| Maximum | 100.0% | 100.0% |
| Range | 5.7% | 4.0% |
| Mean | 98.2% | 99.2% |
| Median | 98.4% | 99.3% |
| Interquartile 25% (IQ1) | 97.7% | 98.9% |
| Interquartile 75% (IQ3) | 99.1% | 100.0% |
| Interquartile Range (IQR) | 1.3% | 1.1% |
| Standard Deviation (Sample) | 1.3% | 0.79% |
| Standard Deviation (Population) | 1.3% | 0.79% |
Similar Demographics by Nursery School
Demographics Similar to Immigrants from Brazil by Nursery School
In terms of nursery school, the demographic groups most similar to Immigrants from Brazil are Kenyan (98.0%, a difference of 0.0%), Navajo (98.0%, a difference of 0.0%), Immigrants from Sri Lanka (98.0%, a difference of 0.0%), Immigrants from Venezuela (98.0%, a difference of 0.0%), and Spanish American (98.0%, a difference of 0.010%).
| Demographics | Rating | Rank | Nursery School |
| Chileans | 56.4 /100 | #165 | Average 98.0% |
| Spanish Americans | 55.6 /100 | #166 | Average 98.0% |
| Immigrants | Spain | 55.6 /100 | #167 | Average 98.0% |
| Immigrants | Micronesia | 55.0 /100 | #168 | Average 98.0% |
| Immigrants | Korea | 53.8 /100 | #169 | Average 98.0% |
| Bermudans | 53.7 /100 | #170 | Average 98.0% |
| Immigrants | Jordan | 53.4 /100 | #171 | Average 98.0% |
| Immigrants | Brazil | 51.3 /100 | #172 | Average 98.0% |
| Kenyans | 50.2 /100 | #173 | Average 98.0% |
| Navajo | 50.0 /100 | #174 | Average 98.0% |
| Immigrants | Sri Lanka | 49.9 /100 | #175 | Average 98.0% |
| Immigrants | Venezuela | 49.8 /100 | #176 | Average 98.0% |
| Albanians | 48.9 /100 | #177 | Average 98.0% |
| Natives/Alaskans | 48.6 /100 | #178 | Average 98.0% |
| Argentineans | 46.8 /100 | #179 | Average 98.0% |
Demographics Similar to Czechs by Nursery School
In terms of nursery school, the demographic groups most similar to Czechs are European (98.6%, a difference of 0.0%), French Canadian (98.6%, a difference of 0.0%), French (98.6%, a difference of 0.010%), Scandinavian (98.6%, a difference of 0.010%), and Croatian (98.6%, a difference of 0.020%).
| Demographics | Rating | Rank | Nursery School |
| Danes | 100.0 /100 | #24 | Exceptional 98.6% |
| Scotch-Irish | 100.0 /100 | #25 | Exceptional 98.6% |
| Sioux | 100.0 /100 | #26 | Exceptional 98.6% |
| Arapaho | 100.0 /100 | #27 | Exceptional 98.6% |
| Croatians | 100.0 /100 | #28 | Exceptional 98.6% |
| French | 100.0 /100 | #29 | Exceptional 98.6% |
| Europeans | 100.0 /100 | #30 | Exceptional 98.6% |
| Czechs | 100.0 /100 | #31 | Exceptional 98.6% |
| French Canadians | 100.0 /100 | #32 | Exceptional 98.6% |
| Scandinavians | 100.0 /100 | #33 | Exceptional 98.6% |
| Chinese | 100.0 /100 | #34 | Exceptional 98.6% |
| Swiss | 100.0 /100 | #35 | Exceptional 98.6% |
| British | 100.0 /100 | #36 | Exceptional 98.5% |
| Lumbee | 99.9 /100 | #37 | Exceptional 98.5% |
| Italians | 99.9 /100 | #38 | Exceptional 98.5% |