Immigrants from Eastern Asia vs Asian No Schooling Completed
COMPARE
Immigrants from Eastern Asia
Asian
No Schooling Completed
No Schooling Completed Comparison
Immigrants from Eastern Asia
Asians
2.4%
NO SCHOOLING COMPLETED
2.0/ 100
METRIC RATING
237th/ 347
METRIC RANK
2.4%
NO SCHOOLING COMPLETED
1.2/ 100
METRIC RATING
248th/ 347
METRIC RANK
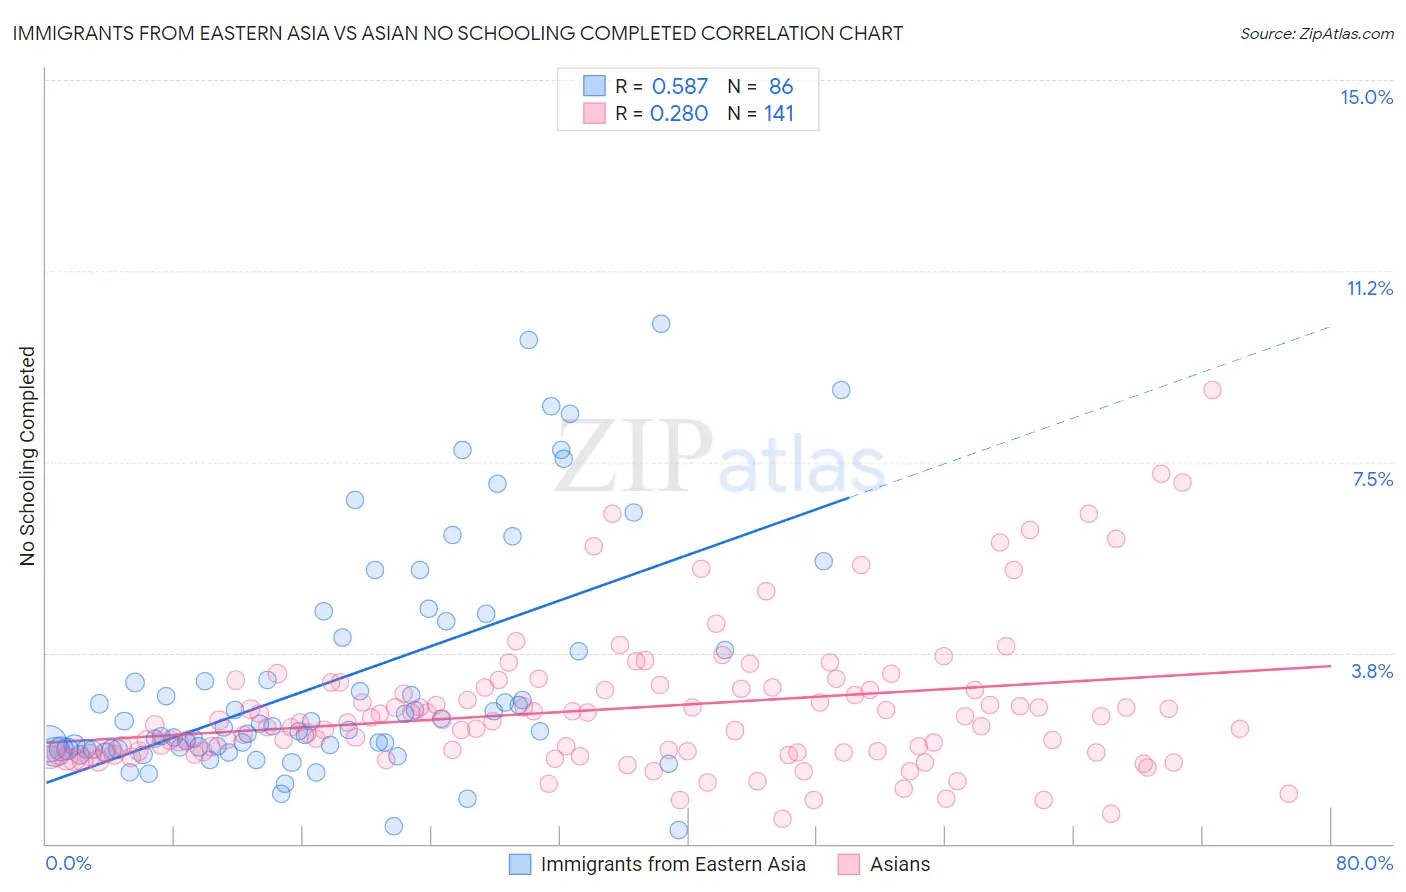
Immigrants from Eastern Asia vs Asian No Schooling Completed Correlation Chart
The statistical analysis conducted on geographies consisting of 491,002,853 people shows a substantial positive correlation between the proportion of Immigrants from Eastern Asia and percentage of population with no schooling in the United States with a correlation coefficient (R) of 0.587 and weighted average of 2.4%. Similarly, the statistical analysis conducted on geographies consisting of 537,405,383 people shows a weak positive correlation between the proportion of Asians and percentage of population with no schooling in the United States with a correlation coefficient (R) of 0.280 and weighted average of 2.4%, a difference of 1.5%.
No Schooling Completed Correlation Summary
| Measurement | Immigrants from Eastern Asia | Asian |
| Minimum | 0.26% | 0.49% |
| Maximum | 10.2% | 8.9% |
| Range | 10.0% | 8.4% |
| Mean | 3.2% | 2.7% |
| Median | 2.3% | 2.4% |
| Interquartile 25% (IQ1) | 1.9% | 1.8% |
| Interquartile 75% (IQ3) | 3.8% | 3.1% |
| Interquartile Range (IQR) | 1.9% | 1.3% |
| Standard Deviation (Sample) | 2.2% | 1.4% |
| Standard Deviation (Population) | 2.2% | 1.4% |
Demographics Similar to Immigrants from Eastern Asia and Asians by No Schooling Completed
In terms of no schooling completed, the demographic groups most similar to Immigrants from Eastern Asia are Iraqi (2.4%, a difference of 0.20%), Paiute (2.4%, a difference of 0.21%), Liberian (2.4%, a difference of 0.33%), Immigrants from Senegal (2.4%, a difference of 0.56%), and Korean (2.4%, a difference of 0.62%). Similarly, the demographic groups most similar to Asians are Jamaican (2.4%, a difference of 0.19%), Immigrants from Middle Africa (2.4%, a difference of 0.24%), Immigrants from Africa (2.4%, a difference of 0.25%), Immigrants from Iraq (2.4%, a difference of 0.27%), and Immigrants from Congo (2.4%, a difference of 0.37%).
| Demographics | Rating | Rank | No Schooling Completed |
| Colombians | 3.2 /100 | #232 | Tragic 2.3% |
| Immigrants | Malaysia | 2.8 /100 | #233 | Tragic 2.3% |
| Nigerians | 2.6 /100 | #234 | Tragic 2.3% |
| Immigrants | Western Asia | 2.6 /100 | #235 | Tragic 2.3% |
| Iraqis | 2.2 /100 | #236 | Tragic 2.4% |
| Immigrants | Eastern Asia | 2.0 /100 | #237 | Tragic 2.4% |
| Paiute | 1.9 /100 | #238 | Tragic 2.4% |
| Liberians | 1.8 /100 | #239 | Tragic 2.4% |
| Immigrants | Senegal | 1.7 /100 | #240 | Tragic 2.4% |
| Koreans | 1.7 /100 | #241 | Tragic 2.4% |
| Immigrants | Indonesia | 1.5 /100 | #242 | Tragic 2.4% |
| South Americans | 1.5 /100 | #243 | Tragic 2.4% |
| Peruvians | 1.4 /100 | #244 | Tragic 2.4% |
| Bolivians | 1.4 /100 | #245 | Tragic 2.4% |
| Immigrants | Congo | 1.4 /100 | #246 | Tragic 2.4% |
| Immigrants | Iraq | 1.3 /100 | #247 | Tragic 2.4% |
| Asians | 1.2 /100 | #248 | Tragic 2.4% |
| Jamaicans | 1.2 /100 | #249 | Tragic 2.4% |
| Immigrants | Middle Africa | 1.1 /100 | #250 | Tragic 2.4% |
| Immigrants | Africa | 1.1 /100 | #251 | Tragic 2.4% |
| Immigrants | Colombia | 1.0 /100 | #252 | Tragic 2.4% |