South American vs South African 5th Grade
COMPARE
South American
South African
5th Grade
5th Grade Comparison
South Americans
South Africans
96.8%
5TH GRADE
0.7/ 100
METRIC RATING
255th/ 347
METRIC RANK
97.7%
5TH GRADE
98.3/ 100
METRIC RATING
101st/ 347
METRIC RANK
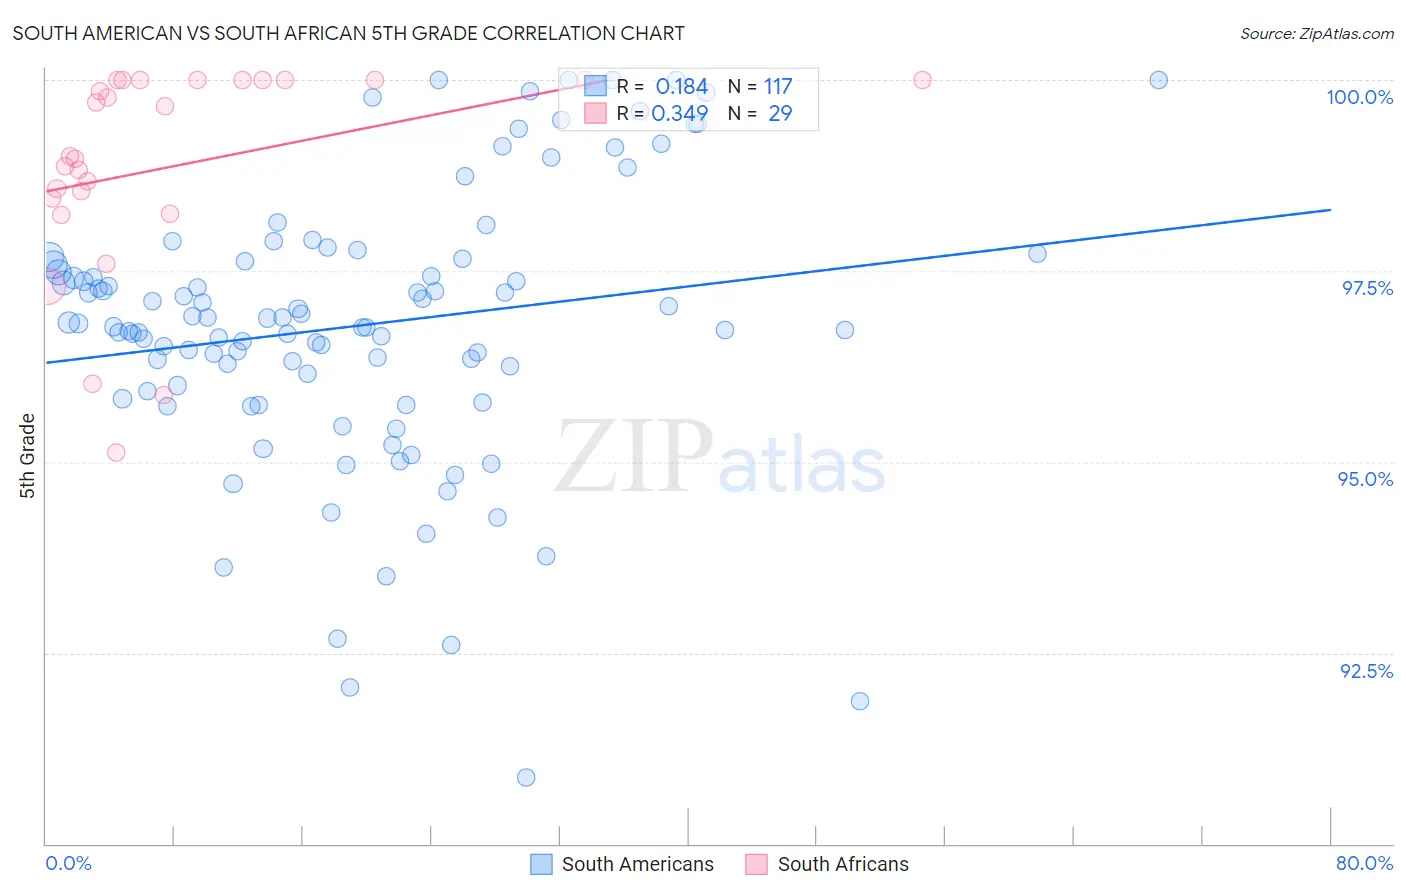
South American vs South African 5th Grade Correlation Chart
The statistical analysis conducted on geographies consisting of 494,178,447 people shows a poor positive correlation between the proportion of South Americans and percentage of population with at least 5th grade education in the United States with a correlation coefficient (R) of 0.184 and weighted average of 96.8%. Similarly, the statistical analysis conducted on geographies consisting of 182,604,532 people shows a mild positive correlation between the proportion of South Africans and percentage of population with at least 5th grade education in the United States with a correlation coefficient (R) of 0.349 and weighted average of 97.7%, a difference of 0.94%.
5th Grade Correlation Summary
| Measurement | South American | South African |
| Minimum | 90.9% | 95.1% |
| Maximum | 100.0% | 100.0% |
| Range | 9.1% | 4.9% |
| Mean | 96.8% | 98.9% |
| Median | 96.8% | 99.0% |
| Interquartile 25% (IQ1) | 96.0% | 98.3% |
| Interquartile 75% (IQ3) | 97.6% | 100.0% |
| Interquartile Range (IQR) | 1.7% | 1.7% |
| Standard Deviation (Sample) | 1.8% | 1.4% |
| Standard Deviation (Population) | 1.8% | 1.3% |
Similar Demographics by 5th Grade
Demographics Similar to South Americans by 5th Grade
In terms of 5th grade, the demographic groups most similar to South Americans are Immigrants from Congo (96.8%, a difference of 0.0%), Peruvian (96.8%, a difference of 0.010%), Immigrants from Middle Africa (96.8%, a difference of 0.020%), Immigrants from Senegal (96.8%, a difference of 0.020%), and Jamaican (96.9%, a difference of 0.030%).
| Demographics | Rating | Rank | 5th Grade |
| U.S. Virgin Islanders | 1.1 /100 | #248 | Tragic 96.9% |
| Immigrants | Uruguay | 1.0 /100 | #249 | Tragic 96.9% |
| Immigrants | Liberia | 1.0 /100 | #250 | Tragic 96.9% |
| Bolivians | 0.9 /100 | #251 | Tragic 96.9% |
| Jamaicans | 0.9 /100 | #252 | Tragic 96.9% |
| Immigrants | Middle Africa | 0.8 /100 | #253 | Tragic 96.8% |
| Immigrants | Senegal | 0.8 /100 | #254 | Tragic 96.8% |
| South Americans | 0.7 /100 | #255 | Tragic 96.8% |
| Immigrants | Congo | 0.7 /100 | #256 | Tragic 96.8% |
| Peruvians | 0.6 /100 | #257 | Tragic 96.8% |
| Immigrants | Ethiopia | 0.5 /100 | #258 | Tragic 96.8% |
| Immigrants | China | 0.5 /100 | #259 | Tragic 96.8% |
| Immigrants | Jamaica | 0.4 /100 | #260 | Tragic 96.8% |
| Immigrants | Sierra Leone | 0.4 /100 | #261 | Tragic 96.8% |
| Immigrants | Colombia | 0.4 /100 | #262 | Tragic 96.8% |
Demographics Similar to South Africans by 5th Grade
In terms of 5th grade, the demographic groups most similar to South Africans are Yugoslavian (97.7%, a difference of 0.0%), Turkish (97.7%, a difference of 0.0%), Puget Sound Salish (97.7%, a difference of 0.0%), Cree (97.7%, a difference of 0.010%), and Immigrants from Denmark (97.8%, a difference of 0.020%).
| Demographics | Rating | Rank | 5th Grade |
| Immigrants | Denmark | 98.6 /100 | #94 | Exceptional 97.8% |
| Romanians | 98.6 /100 | #95 | Exceptional 97.8% |
| Immigrants | Germany | 98.5 /100 | #96 | Exceptional 97.8% |
| Cree | 98.4 /100 | #97 | Exceptional 97.7% |
| Yugoslavians | 98.3 /100 | #98 | Exceptional 97.7% |
| Turks | 98.3 /100 | #99 | Exceptional 97.7% |
| Puget Sound Salish | 98.3 /100 | #100 | Exceptional 97.7% |
| South Africans | 98.3 /100 | #101 | Exceptional 97.7% |
| Choctaw | 98.0 /100 | #102 | Exceptional 97.7% |
| Cheyenne | 97.9 /100 | #103 | Exceptional 97.7% |
| German Russians | 97.8 /100 | #104 | Exceptional 97.7% |
| Bhutanese | 97.6 /100 | #105 | Exceptional 97.7% |
| Immigrants | Czechoslovakia | 97.5 /100 | #106 | Exceptional 97.7% |
| Immigrants | Singapore | 97.5 /100 | #107 | Exceptional 97.7% |
| Immigrants | Nonimmigrants | 97.3 /100 | #108 | Exceptional 97.7% |