Immigrants from Bosnia and Herzegovina vs Immigrants from Spain Kindergarten
COMPARE
Immigrants from Bosnia and Herzegovina
Immigrants from Spain
Kindergarten
Kindergarten Comparison
Immigrants from Bosnia and Herzegovina
Immigrants from Spain
97.9%
KINDERGARTEN
46.7/ 100
METRIC RATING
180th/ 347
METRIC RANK
98.0%
KINDERGARTEN
54.6/ 100
METRIC RATING
167th/ 347
METRIC RANK
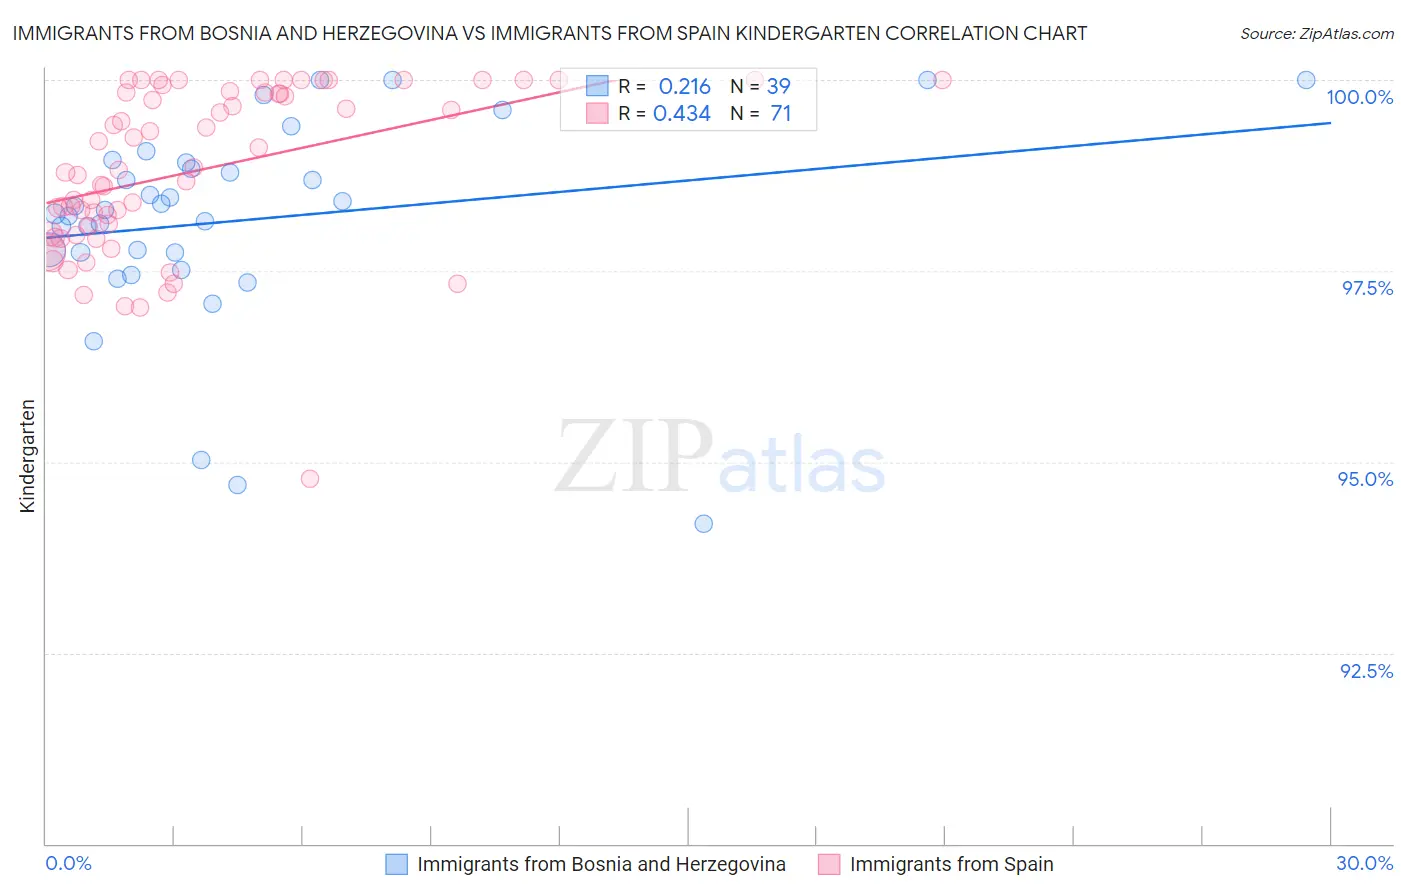
Immigrants from Bosnia and Herzegovina vs Immigrants from Spain Kindergarten Correlation Chart
The statistical analysis conducted on geographies consisting of 156,779,463 people shows a weak positive correlation between the proportion of Immigrants from Bosnia and Herzegovina and percentage of population with at least kindergarten education in the United States with a correlation coefficient (R) of 0.216 and weighted average of 97.9%. Similarly, the statistical analysis conducted on geographies consisting of 239,682,160 people shows a moderate positive correlation between the proportion of Immigrants from Spain and percentage of population with at least kindergarten education in the United States with a correlation coefficient (R) of 0.434 and weighted average of 98.0%, a difference of 0.020%.
Kindergarten Correlation Summary
| Measurement | Immigrants from Bosnia and Herzegovina | Immigrants from Spain |
| Minimum | 94.2% | 94.8% |
| Maximum | 100.0% | 100.0% |
| Range | 5.8% | 5.2% |
| Mean | 98.2% | 98.8% |
| Median | 98.3% | 98.8% |
| Interquartile 25% (IQ1) | 97.7% | 98.0% |
| Interquartile 75% (IQ3) | 98.9% | 99.8% |
| Interquartile Range (IQR) | 1.2% | 1.9% |
| Standard Deviation (Sample) | 1.3% | 1.1% |
| Standard Deviation (Population) | 1.3% | 1.1% |
Demographics Similar to Immigrants from Bosnia and Herzegovina and Immigrants from Spain by Kindergarten
In terms of kindergarten, the demographic groups most similar to Immigrants from Bosnia and Herzegovina are Immigrants from Venezuela (97.9%, a difference of 0.0%), Brazilian (97.9%, a difference of 0.0%), Argentinean (97.9%, a difference of 0.0%), Native/Alaskan (98.0%, a difference of 0.010%), and Kenyan (98.0%, a difference of 0.010%). Similarly, the demographic groups most similar to Immigrants from Spain are Navajo (98.0%, a difference of 0.0%), Immigrants from Korea (98.0%, a difference of 0.0%), Bermudan (98.0%, a difference of 0.0%), Immigrants from Jordan (98.0%, a difference of 0.0%), and Spanish American (98.0%, a difference of 0.010%).
| Demographics | Rating | Rank | Kindergarten |
| Spanish Americans | 57.8 /100 | #163 | Average 98.0% |
| Immigrants | Micronesia | 57.7 /100 | #164 | Average 98.0% |
| Ugandans | 56.9 /100 | #165 | Average 98.0% |
| Chileans | 56.3 /100 | #166 | Average 98.0% |
| Immigrants | Spain | 54.6 /100 | #167 | Average 98.0% |
| Navajo | 54.4 /100 | #168 | Average 98.0% |
| Immigrants | Korea | 54.1 /100 | #169 | Average 98.0% |
| Bermudans | 54.0 /100 | #170 | Average 98.0% |
| Immigrants | Jordan | 54.0 /100 | #171 | Average 98.0% |
| Natives/Alaskans | 51.0 /100 | #172 | Average 98.0% |
| Kenyans | 51.0 /100 | #173 | Average 98.0% |
| Immigrants | Brazil | 50.0 /100 | #174 | Average 98.0% |
| Immigrants | Sri Lanka | 49.6 /100 | #175 | Average 97.9% |
| Albanians | 48.5 /100 | #176 | Average 97.9% |
| Immigrants | Venezuela | 47.9 /100 | #177 | Average 97.9% |
| Brazilians | 47.6 /100 | #178 | Average 97.9% |
| Argentineans | 46.8 /100 | #179 | Average 97.9% |
| Immigrants | Bosnia and Herzegovina | 46.7 /100 | #180 | Average 97.9% |
| Portuguese | 43.5 /100 | #181 | Average 97.9% |
| Egyptians | 42.4 /100 | #182 | Average 97.9% |
| Immigrants | Poland | 41.4 /100 | #183 | Average 97.9% |