Immigrants from Bosnia and Herzegovina vs Nigerian Kindergarten
COMPARE
Immigrants from Bosnia and Herzegovina
Nigerian
Kindergarten
Kindergarten Comparison
Immigrants from Bosnia and Herzegovina
Nigerians
97.9%
KINDERGARTEN
46.7/ 100
METRIC RATING
180th/ 347
METRIC RANK
97.6%
KINDERGARTEN
1.8/ 100
METRIC RATING
237th/ 347
METRIC RANK
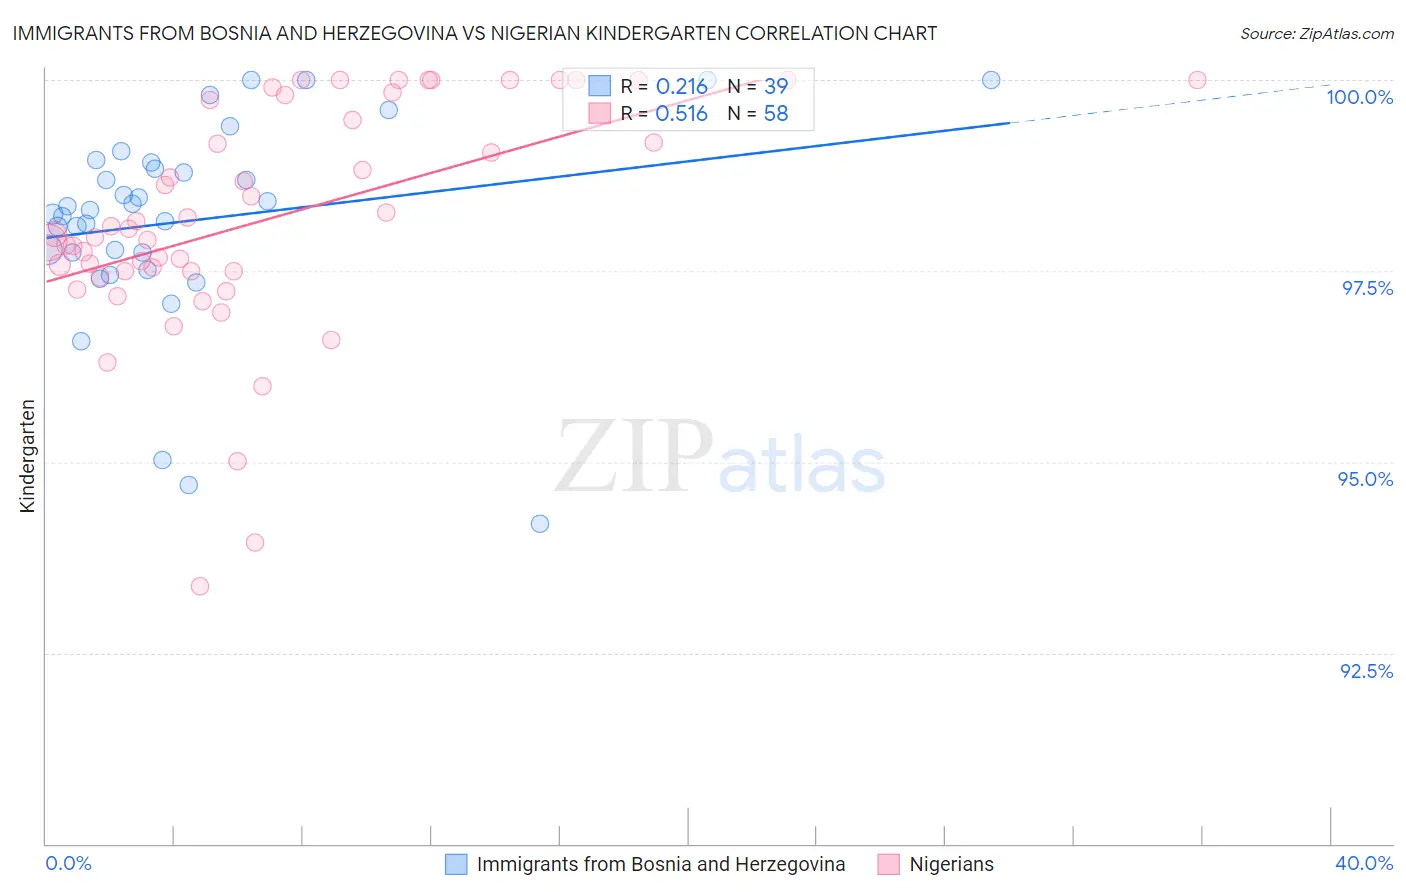
Immigrants from Bosnia and Herzegovina vs Nigerian Kindergarten Correlation Chart
The statistical analysis conducted on geographies consisting of 156,779,463 people shows a weak positive correlation between the proportion of Immigrants from Bosnia and Herzegovina and percentage of population with at least kindergarten education in the United States with a correlation coefficient (R) of 0.216 and weighted average of 97.9%. Similarly, the statistical analysis conducted on geographies consisting of 332,724,627 people shows a substantial positive correlation between the proportion of Nigerians and percentage of population with at least kindergarten education in the United States with a correlation coefficient (R) of 0.516 and weighted average of 97.6%, a difference of 0.30%.
Kindergarten Correlation Summary
| Measurement | Immigrants from Bosnia and Herzegovina | Nigerian |
| Minimum | 94.2% | 93.4% |
| Maximum | 100.0% | 100.0% |
| Range | 5.8% | 6.6% |
| Mean | 98.2% | 98.2% |
| Median | 98.3% | 98.0% |
| Interquartile 25% (IQ1) | 97.7% | 97.5% |
| Interquartile 75% (IQ3) | 98.9% | 99.7% |
| Interquartile Range (IQR) | 1.2% | 2.2% |
| Standard Deviation (Sample) | 1.3% | 1.5% |
| Standard Deviation (Population) | 1.3% | 1.5% |
Similar Demographics by Kindergarten
Demographics Similar to Immigrants from Bosnia and Herzegovina by Kindergarten
In terms of kindergarten, the demographic groups most similar to Immigrants from Bosnia and Herzegovina are Immigrants from Venezuela (97.9%, a difference of 0.0%), Brazilian (97.9%, a difference of 0.0%), Argentinean (97.9%, a difference of 0.0%), Kenyan (98.0%, a difference of 0.010%), and Immigrants from Brazil (98.0%, a difference of 0.010%).
| Demographics | Rating | Rank | Kindergarten |
| Kenyans | 51.0 /100 | #173 | Average 98.0% |
| Immigrants | Brazil | 50.0 /100 | #174 | Average 98.0% |
| Immigrants | Sri Lanka | 49.6 /100 | #175 | Average 97.9% |
| Albanians | 48.5 /100 | #176 | Average 97.9% |
| Immigrants | Venezuela | 47.9 /100 | #177 | Average 97.9% |
| Brazilians | 47.6 /100 | #178 | Average 97.9% |
| Argentineans | 46.8 /100 | #179 | Average 97.9% |
| Immigrants | Bosnia and Herzegovina | 46.7 /100 | #180 | Average 97.9% |
| Portuguese | 43.5 /100 | #181 | Average 97.9% |
| Egyptians | 42.4 /100 | #182 | Average 97.9% |
| Immigrants | Poland | 41.4 /100 | #183 | Average 97.9% |
| Immigrants | Argentina | 40.7 /100 | #184 | Average 97.9% |
| Immigrants | Belarus | 39.4 /100 | #185 | Fair 97.9% |
| Pakistanis | 36.0 /100 | #186 | Fair 97.9% |
| Immigrants | Kazakhstan | 35.9 /100 | #187 | Fair 97.9% |
Demographics Similar to Nigerians by Kindergarten
In terms of kindergarten, the demographic groups most similar to Nigerians are Immigrants from Eastern Asia (97.6%, a difference of 0.0%), U.S. Virgin Islander (97.6%, a difference of 0.0%), Immigrants from Western Asia (97.7%, a difference of 0.010%), Korean (97.6%, a difference of 0.010%), and Immigrants from Pakistan (97.7%, a difference of 0.020%).
| Demographics | Rating | Rank | Kindergarten |
| Senegalese | 3.3 /100 | #230 | Tragic 97.7% |
| Puerto Ricans | 2.7 /100 | #231 | Tragic 97.7% |
| Immigrants | Uruguay | 2.6 /100 | #232 | Tragic 97.7% |
| Immigrants | Pakistan | 2.2 /100 | #233 | Tragic 97.7% |
| Immigrants | Malaysia | 2.2 /100 | #234 | Tragic 97.7% |
| Colombians | 2.2 /100 | #235 | Tragic 97.7% |
| Immigrants | Western Asia | 2.1 /100 | #236 | Tragic 97.7% |
| Nigerians | 1.8 /100 | #237 | Tragic 97.6% |
| Immigrants | Eastern Asia | 1.7 /100 | #238 | Tragic 97.6% |
| U.S. Virgin Islanders | 1.7 /100 | #239 | Tragic 97.6% |
| Koreans | 1.6 /100 | #240 | Tragic 97.6% |
| Liberians | 1.3 /100 | #241 | Tragic 97.6% |
| Immigrants | Indonesia | 1.3 /100 | #242 | Tragic 97.6% |
| Asians | 1.2 /100 | #243 | Tragic 97.6% |
| Bolivians | 1.2 /100 | #244 | Tragic 97.6% |