Immigrants from Ukraine vs Brazilian Nursery School
COMPARE
Immigrants from Ukraine
Brazilian
Nursery School
Nursery School Comparison
Immigrants from Ukraine
Brazilians
97.9%
NURSERY SCHOOL
19.9/ 100
METRIC RATING
202nd/ 347
METRIC RANK
98.0%
NURSERY SCHOOL
59.4/ 100
METRIC RATING
162nd/ 347
METRIC RANK
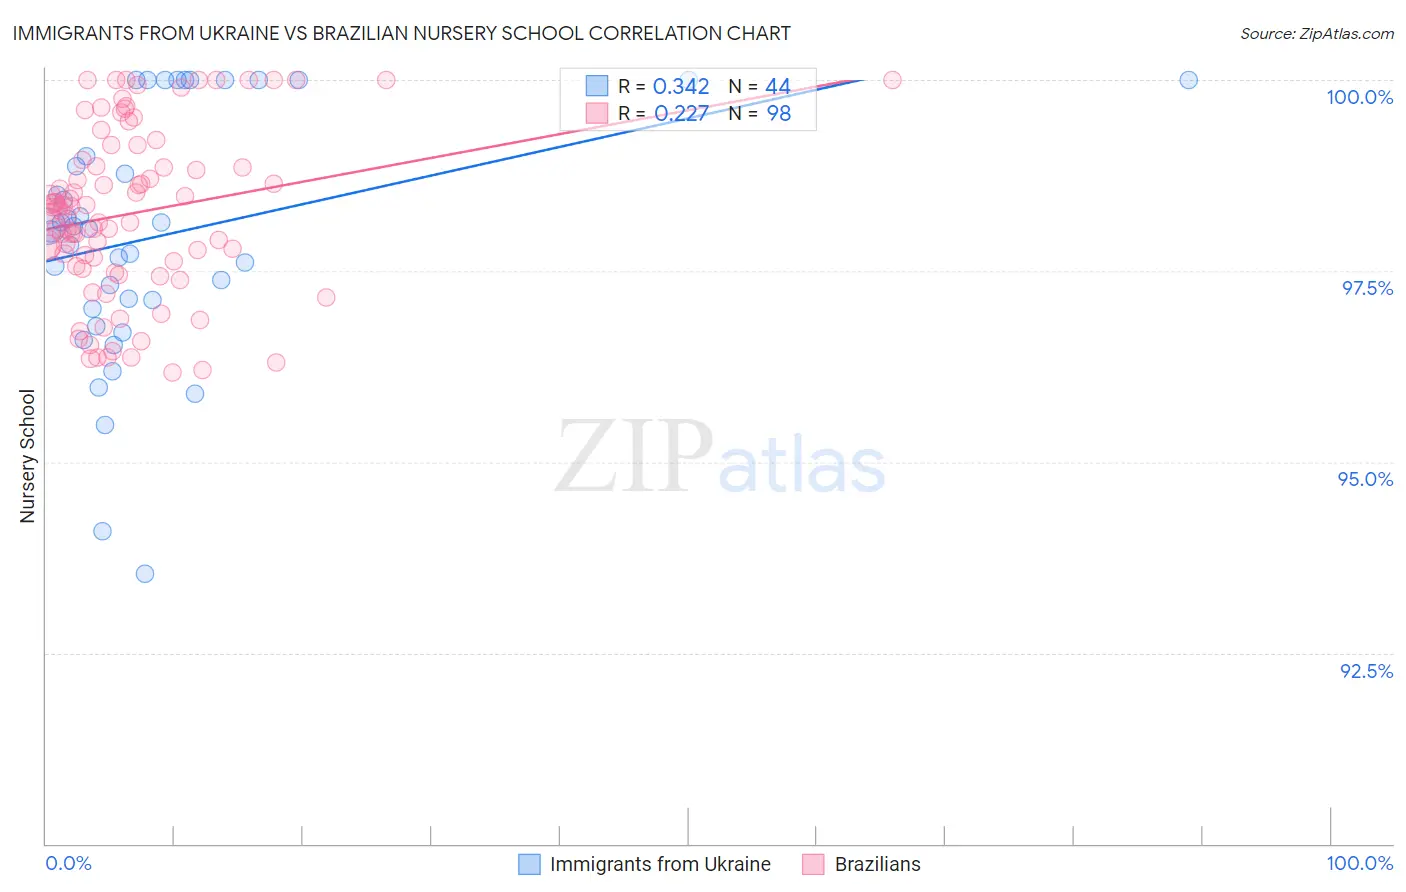
Immigrants from Ukraine vs Brazilian Nursery School Correlation Chart
The statistical analysis conducted on geographies consisting of 289,712,791 people shows a mild positive correlation between the proportion of Immigrants from Ukraine and percentage of population with at least nursery school education in the United States with a correlation coefficient (R) of 0.342 and weighted average of 97.9%. Similarly, the statistical analysis conducted on geographies consisting of 323,863,770 people shows a weak positive correlation between the proportion of Brazilians and percentage of population with at least nursery school education in the United States with a correlation coefficient (R) of 0.227 and weighted average of 98.0%, a difference of 0.13%.
Nursery School Correlation Summary
| Measurement | Immigrants from Ukraine | Brazilian |
| Minimum | 93.5% | 96.2% |
| Maximum | 100.0% | 100.0% |
| Range | 6.5% | 3.8% |
| Mean | 98.0% | 98.3% |
| Median | 98.1% | 98.3% |
| Interquartile 25% (IQ1) | 97.1% | 97.6% |
| Interquartile 75% (IQ3) | 99.5% | 99.0% |
| Interquartile Range (IQR) | 2.4% | 1.4% |
| Standard Deviation (Sample) | 1.6% | 1.1% |
| Standard Deviation (Population) | 1.6% | 1.1% |
Similar Demographics by Nursery School
Demographics Similar to Immigrants from Ukraine by Nursery School
In terms of nursery school, the demographic groups most similar to Immigrants from Ukraine are Immigrants from Egypt (97.9%, a difference of 0.010%), Tohono O'odham (97.9%, a difference of 0.010%), Immigrants from Lebanon (97.9%, a difference of 0.010%), Immigrants from Uganda (97.9%, a difference of 0.010%), and Immigrants from Southern Europe (97.9%, a difference of 0.010%).
| Demographics | Rating | Rank | Nursery School |
| Hawaiians | 27.2 /100 | #195 | Fair 97.9% |
| Guamanians/Chamorros | 25.7 /100 | #196 | Fair 97.9% |
| Yuman | 25.7 /100 | #197 | Fair 97.9% |
| Immigrants | Kenya | 24.1 /100 | #198 | Fair 97.9% |
| Immigrants | Egypt | 22.5 /100 | #199 | Fair 97.9% |
| Tohono O'odham | 22.2 /100 | #200 | Fair 97.9% |
| Immigrants | Lebanon | 21.2 /100 | #201 | Fair 97.9% |
| Immigrants | Ukraine | 19.9 /100 | #202 | Poor 97.9% |
| Immigrants | Uganda | 18.0 /100 | #203 | Poor 97.9% |
| Immigrants | Southern Europe | 17.4 /100 | #204 | Poor 97.9% |
| Immigrants | Chile | 17.3 /100 | #205 | Poor 97.9% |
| Immigrants | Albania | 16.4 /100 | #206 | Poor 97.9% |
| Africans | 15.4 /100 | #207 | Poor 97.9% |
| Immigrants | Northern Africa | 11.7 /100 | #208 | Poor 97.8% |
| Costa Ricans | 11.3 /100 | #209 | Poor 97.8% |
Demographics Similar to Brazilians by Nursery School
In terms of nursery school, the demographic groups most similar to Brazilians are Immigrants from Russia (98.0%, a difference of 0.0%), Immigrants from Eastern Europe (98.0%, a difference of 0.0%), Immigrants from Italy (98.0%, a difference of 0.0%), French American Indian (98.0%, a difference of 0.010%), and Ugandan (98.0%, a difference of 0.010%).
| Demographics | Rating | Rank | Nursery School |
| Immigrants | South Central Asia | 66.7 /100 | #155 | Good 98.0% |
| Venezuelans | 66.6 /100 | #156 | Good 98.0% |
| Comanche | 66.0 /100 | #157 | Good 98.0% |
| Immigrants | North Macedonia | 65.7 /100 | #158 | Good 98.0% |
| French American Indians | 62.1 /100 | #159 | Good 98.0% |
| Immigrants | Russia | 59.9 /100 | #160 | Average 98.0% |
| Immigrants | Eastern Europe | 59.7 /100 | #161 | Average 98.0% |
| Brazilians | 59.4 /100 | #162 | Average 98.0% |
| Immigrants | Italy | 59.0 /100 | #163 | Average 98.0% |
| Ugandans | 56.4 /100 | #164 | Average 98.0% |
| Chileans | 56.4 /100 | #165 | Average 98.0% |
| Spanish Americans | 55.6 /100 | #166 | Average 98.0% |
| Immigrants | Spain | 55.6 /100 | #167 | Average 98.0% |
| Immigrants | Micronesia | 55.0 /100 | #168 | Average 98.0% |
| Immigrants | Korea | 53.8 /100 | #169 | Average 98.0% |